Digital Fact Book: From Data to Storytelling
Each year, most Institutional Research (IR) offices publish a Fact Book containing all the facts and figures pertaining to their institutions for distribution to board members, the leadership team, faculty, staff, and students. The Fact Book presents a holistic view of an institution with information on everything, including admissions and enrollment, academics, graduation, retention, financial aid, and student life. A very resourceful publication, the Fact Book is utilized by leadership to make data-informed decisions and by other campus offices to apply for grants and complete external surveys.
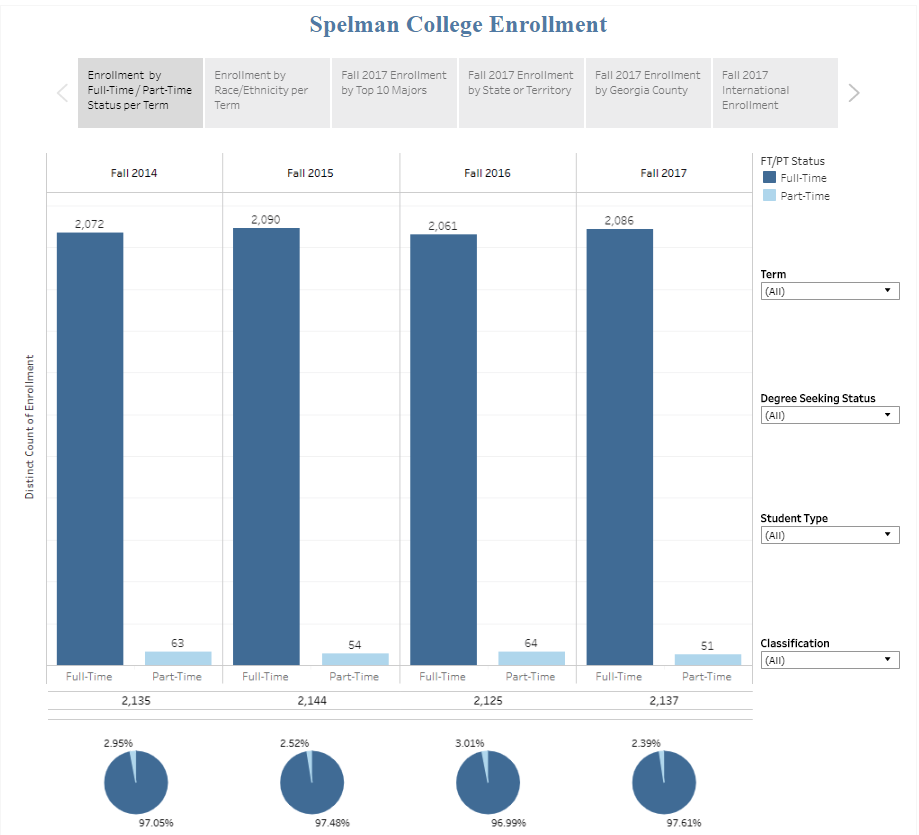
I’ve taken the traditional Fact Book and made it “Digital.” The Spelman College Digital Fact Book provides an overview of the college’s most recent enrollment, graduation, and retention data. It is an interactive data experience, which uses dynamic data visualizations and tables. Users are able to employ available data filters to specify parameters and gain valuable insight about the college. These ad hoc reports can then be downloaded in PDF format for later use.
The Enrollment section of the Digital Fact Book provides data on total student enrollment by declared major, race/ethnicity, and residency. Filters are provided throughout the data experience, allowing users to manipulate and isolate data at different levels including by term, degree status, student type, and classification. You can view the Digital Fact Book - Enrollment section, here. Click on each tab for more information.

