Embedding Deeper Insights into Qualtrics Dashboard
As data scientists and university employees we cannot underestimate the value of extra time. Having said that, we also understand the importance and value behind spending time discovering data and communicating its insights to stakeholders. Data cannot speak for itself, but can we make it more accessible and easier to comprehend for our stakeholders, so they can act on its insights to drive the decision making processes. A dashboard created once can help to save time on reporting and creation of data visualizations. However, what if simply displaying the survey results is not enough? What if stakeholder wants to know more about the data using their own evaluation system and custom metrics that are not built into Qualtrics? The custom metric tab allows you to create new metrics and take the data insights to the next level.
Adding a custom metric to the dashboard
- Click on the Setting icon to access the Custom Metric Tab.

- Click on ‘Add Custom Metric’. You will see blank fields where you can name your metric and construct your equation.


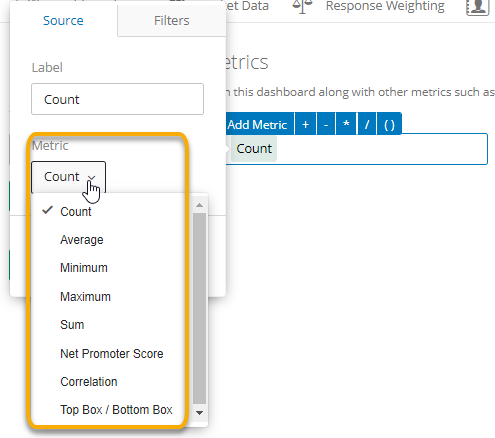
- You should start by adding a metric. By default, count will automatically be displayed.

If you want to select another metric, click on count and you will see the menu with other metric options.

- Next to the ‘Add Metric’ you can select different mathematical operations (in blue) you can perform with metrics.
Examples of Custom Metrics
Qualtrics dashboard does not have a response rate calculation. However, if you have embedded data fields from the contact list that can tell you the number of participants, you can create a custom metric that will calculate a response rate. For example, we have a final enrollment number as one of our embedded data fields and Qualtrics already shows us the number of respondents. We can create a custom metric ‘Response Rate’: number of survey respondents / final enrollment.

You can also use custom metrics to calculate the scores that the survey respondents get in the survey. For instance, a peer-evaluation survey that asks a student to evaluate their peers. The evaluation consists of 5 questions (each questions is its own category) and the maximum score in each category is 5. In this example, we need to show what score the survey respondent gave their peers along with the max score the respondent could have given. Taking into consideration that some students might fill out the survey for only a couple of students and other students might fill out evaluation for all students, the maximum score will differ for every student. In this case, we create a ‘Highest Possible Score’ that will adjust depending on how many students a survey participant evaluated. Since the max score for each question (rubric of the evaluation) is 5 and there are 5 questions, the highest possible score is the number of respondents multiplied by 5 and then 4.

Now we can display the maximum score along with the respondent’s score.

Custom metrics can also be used to create standard deviation and mode as Qualtrics does not currently have these metrics.
Custom metrics offer an opportunity to deliver more insights to stakeholders.
How to display custom metrics on the dashboard
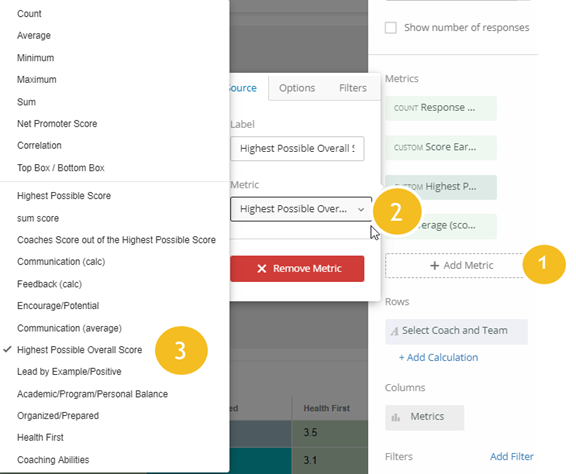
Click on edit a widget and choose ‘+Add Metric’. Select the custom metric of your choice. Custom metrics will be displayed on the bottom of the metrics menu.

While the sky is the limit in the custom metrics tab, we need to keep in mind that the dashboard has to tell the story everyone can understand. Here are a few information design tips for using custom metrics and embedding them into widgets.
Information Design Tips
- Use a clear title.
- Add descriptions to more complex metrics.
- Include number of respondents.
