-
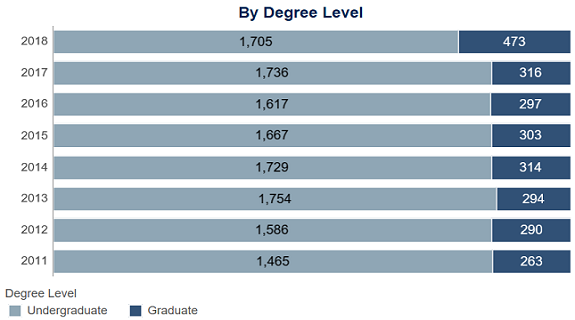
Degrees Awarded Dashboard: University of Southern Indiana
The Degrees Awarded dashboard is a section in our University Fact Book, which is powered by Tableau. The dashboard represents the number of degrees awarded each academic year and can be filtered by college, department, a...Read Moreabout: Degrees Awarded Dashboard: University of Southern Indiana -
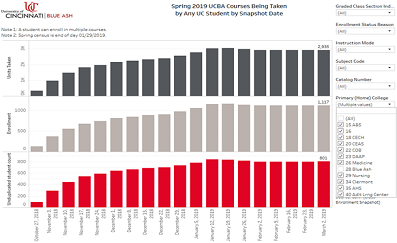
Course Enrollment Trends Dashboard
University of Cincinnati students often take classes offered at other UC campuses and vice versa. UC Blue Ash regional campus administrators and academic chairs wanted to better understand how many UCBA students we...Read Moreabout: Course Enrollment Trends Dashboard -
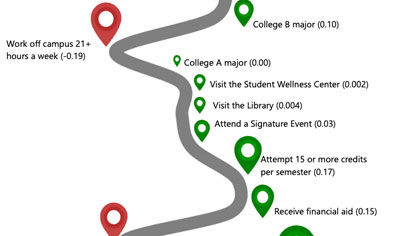
Visualizing Regression Results for Non-Statistics Audiences
The Office of Assessment at the University of North Florida (UNF) uses infographics to succinctly visualize student engagement and success data. We’ve found them to be a useful platform to share focused messages wi...Read Moreabout: Visualizing Regression Results for Non-Statistics Audiences -
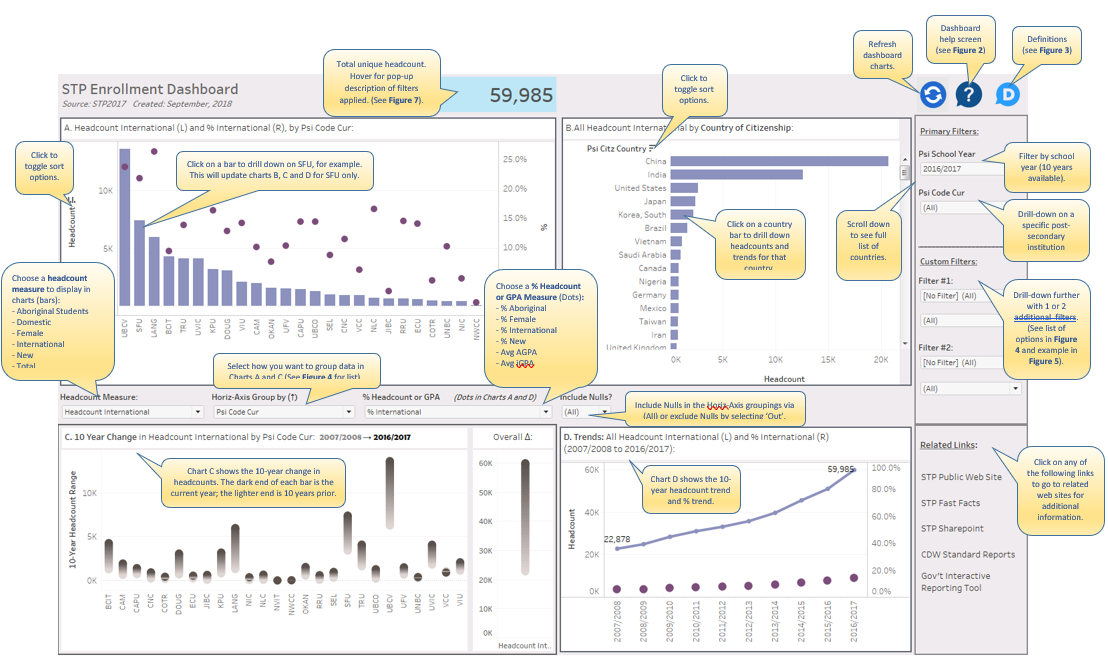
Visual Guide to STP Enrollment Dashboard in Tableau
Figure 1: STP Enrollment Dashboard Introduction Tim Miller, a blogger for DataViz at Data Science Central, recently offered suggestions for Creating a Great Information Dashboard. He nicely summarized some of the...Read Moreabout: Visual Guide to STP Enrollment Dashboard in Tableau -
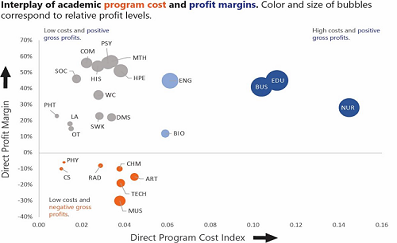
Analyzing Academic Program Fiscal Performance
Understanding the financial viability of academic programs is increasingly at the forefront of discussions at small colleges and universities. However, a simple analysis of direct gross profits can be misleading if not p...Read Moreabout: Analyzing Academic Program Fiscal Performance
- 1
- 2
- 3
- 4 (current)
- 5
About eAIR
eAIR is the newsletter of the Association for Institutional Research (AIR). From its start in October 1987 to today, eAIR remains one of the most important tools for providing news to the higher education community.
View Articles By Column
- Special Feature (3)
- Featured (101)
- National Survey Data Bite (51)
- Tech Tips (42)
- Board Corner (44)
- Special Feature / Interview (25)
- Interview (5)
- Ask eAIR (20)
- IPEDS/NCES (9)
- IR In The Know (42)
- Visual Displays of Data (23)
Hot Topics
- COVID (1)
- Ethics Spotlight (3)
Subscribe
Create a free account or update your communication preferences to receive the eAIR newsletter.
Thank You
2021 Editorial Committee
Association at a Glance
Featured Opportunities
AIR Foundations Workshops
Introducing the skills needed for a strong data-informed decision culture. Designed for anyone who works closely with data in higher ed—not just IR professionals.
-
IPEDS Face-to-Face - March 2020
Dec 16, 2019, 15:22 PM
-
Coffee Chats 2021
Jun 15, 2021, 20:43 PM
Did you know?
AIR welcomes brief conference/event announcements of interest to the IR and higher education communities.
Learn More
Recent Discussions
Listings Closing Soon
Total jobs: 3
| Job Title | Institution | Location | Salary Range | Application Due Date | Control Column |
|---|---|---|---|---|---|
| Title V Data Research Analyst | Mount Saint Mary's University, Los Angeles | CA | Dependent on qualifications and experience | 2024-06-30 | |
| Director, Academic Effectiveness | University of San Diego | CA | $8583 - $11666 | 2024-06-07 | |
| Data Visualization Specialist | Bellevue College | WA | $73539 - $106632 | 2024-06-02 |