IR Office Work Portfolios
This brief is one of a series of reports. Learn more at airweb.org/nationalsurvey.
Each institutional research (IR) office resides in a unique college or university environment in which other data and analytics units may or may not contribute to the collective data function across the institution. As such, categorizing IR offices is challenging. The 2018 AIR National Survey of IR Offices sought to do so through evaluation of IR office work portfolios.
Portfolios of Work: Broad, Focused, and Limited
We asked IR office leaders to review a list of 25 informational studies (e.g., IPEDS reporting, course evaluations, space utilization studies) and to estimate relevant percentages of work their offices contribute. Using factor analyses, we reduced those 25 studies to 13 factors.
Through cluster analyses we identified three main clusters of IR offices based on their work portfolios: (1) broad, (2) focused, and (3) limited (Chart 1). These clusters mirror relationships identified in the 2015 AIR National Survey of IR Offices.1

Below, we explore each cluster and detail the unique characteristics of each work portfolio they represent.
Cluster 1: Broad Portfolios of Work
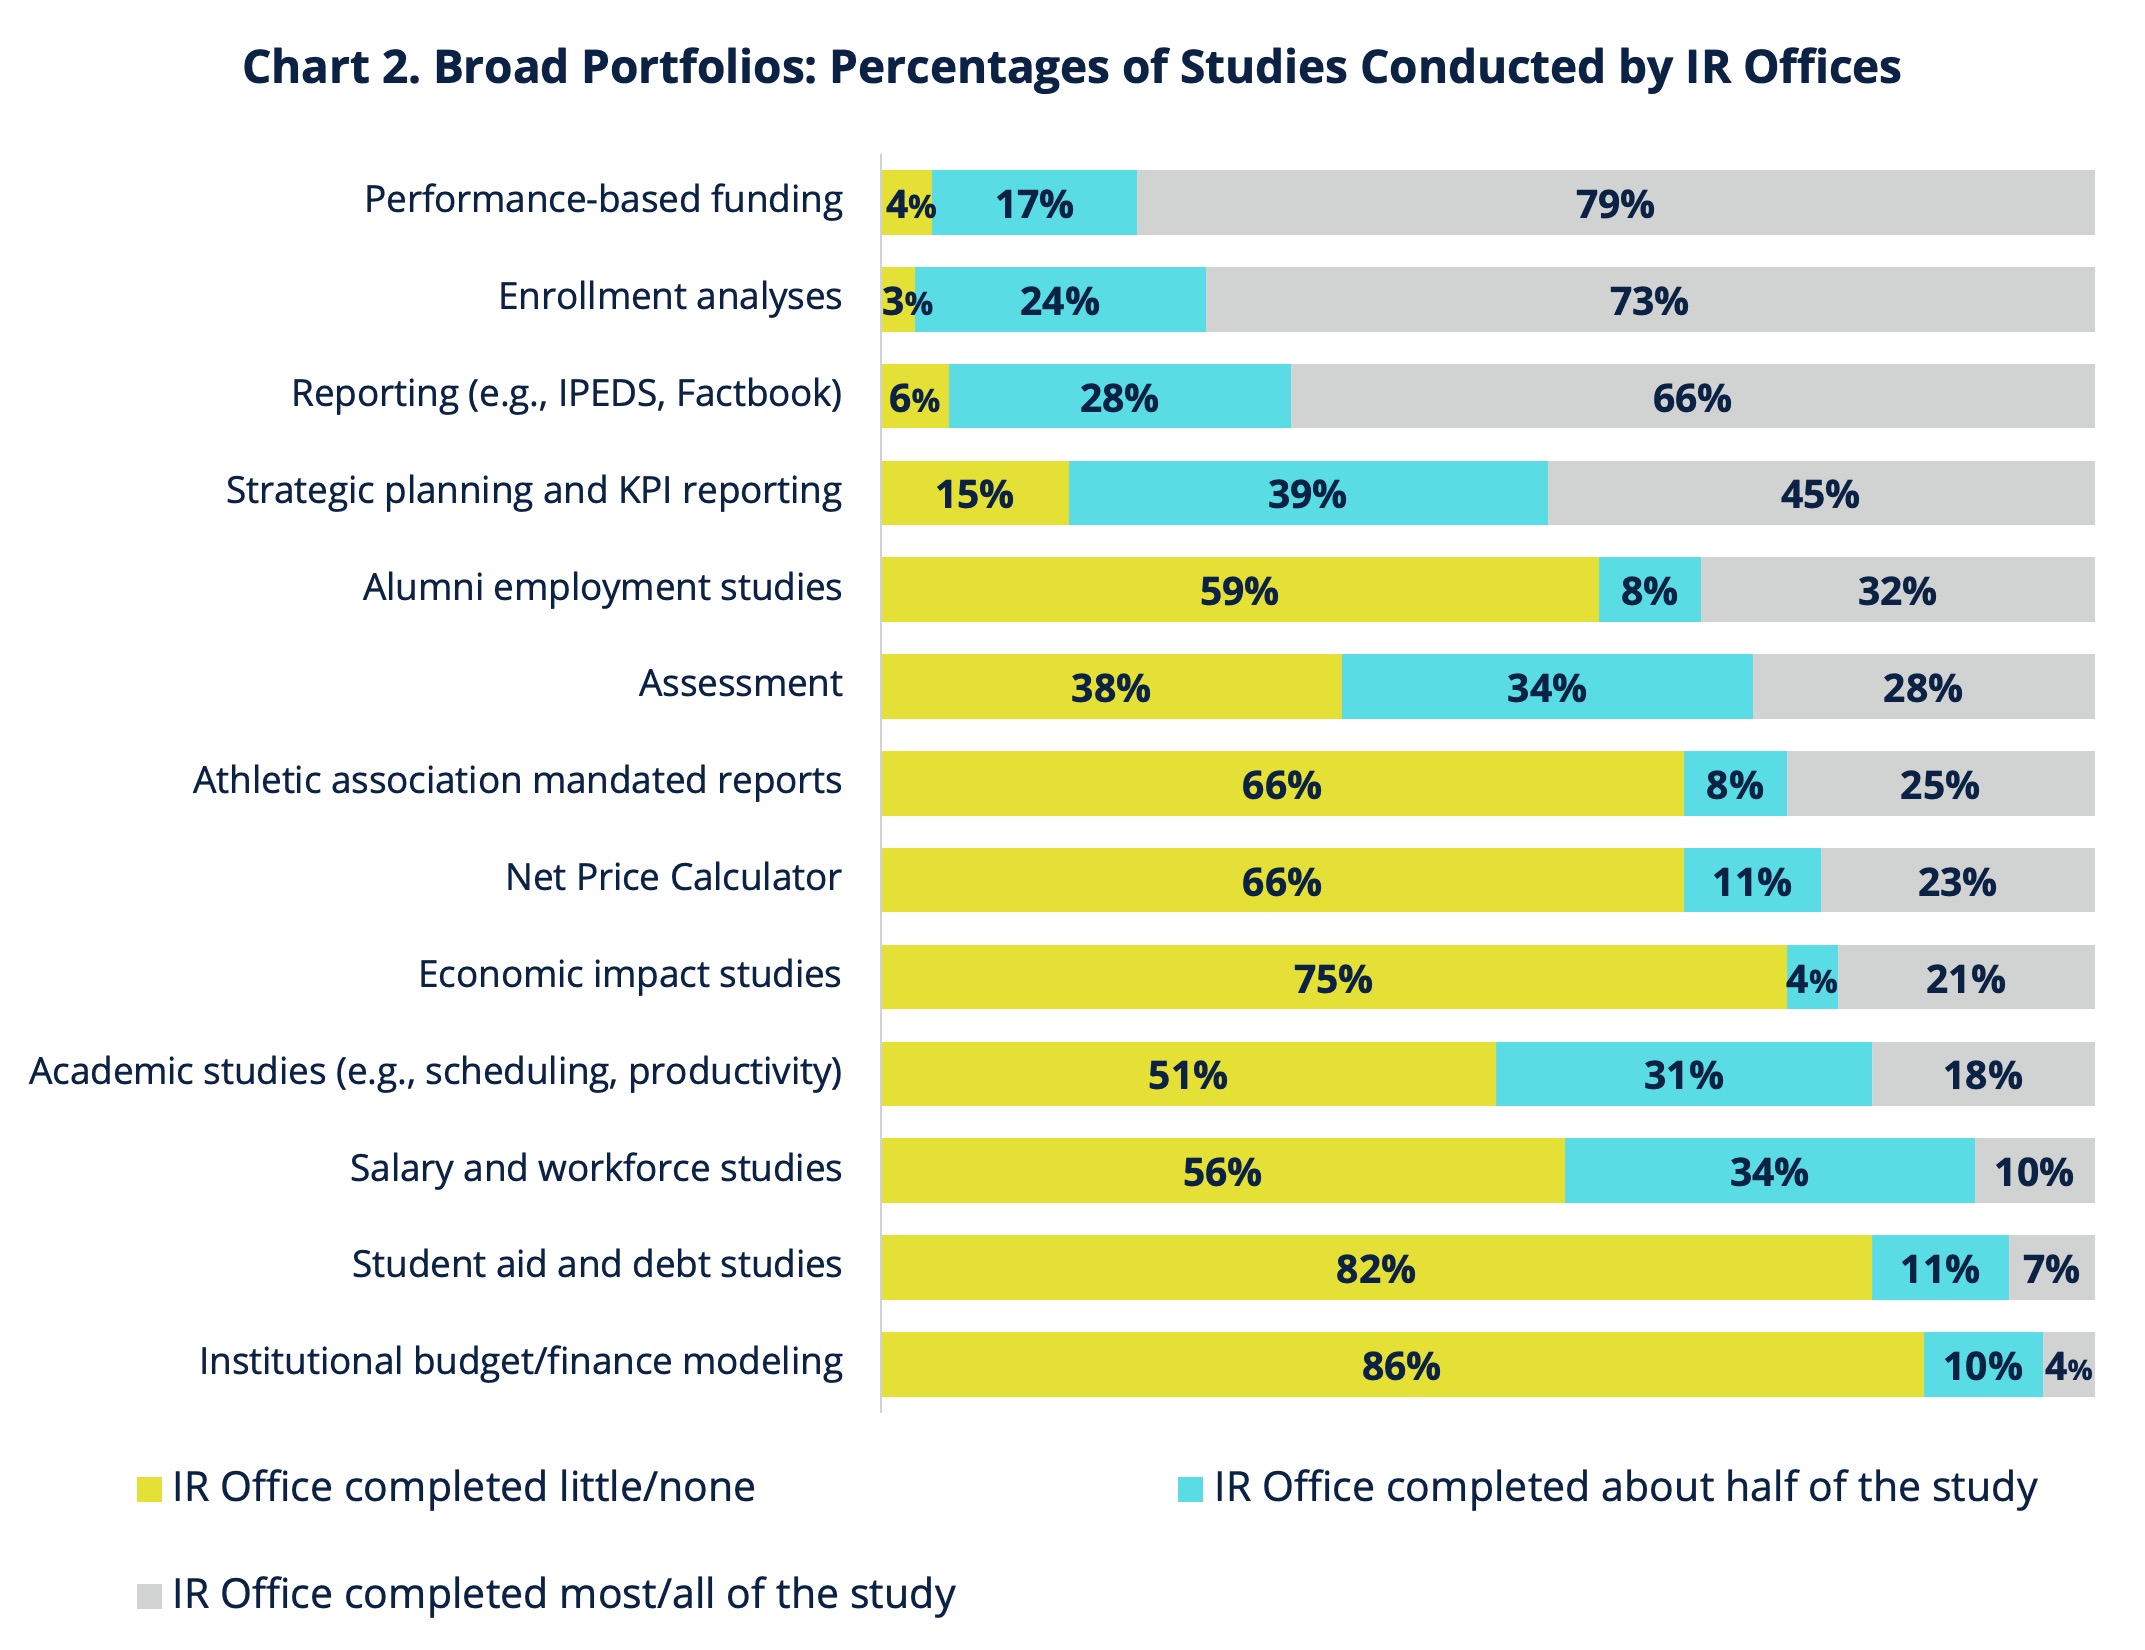
IR offices with broad portfolios of work produce or contribute to wide breadths of institutional studies. Only 16% of IR offices fall into this category.
Chart 2 shows groupings of informational studies based on the results of the factor analyses and the percentages of IR offices that completed little/none, about half, or most of the studies. For example, 79% of IR offices in the broad portfolio cluster completed most/all performance-based funding analyses and 73% completed most/all enrollment analyses. On the other hand, 86% of IR offices in this cluster performed little to no institutional budget/finance modeling.
IR offices in the broad portfolio of work cluster are overwhelmingly from the public sector (48% are public 2-year institutions and 49% are public 4-year institutions) compared to just 3% of private not-for-profit 4-year institutions.2 They also have the largest average staff full-time equivalent (FTE) at 5.4 compared to approximately 3.4 staff FTE for the focused and limited clusters.
Cluster 2: Focused Portfolios of Work
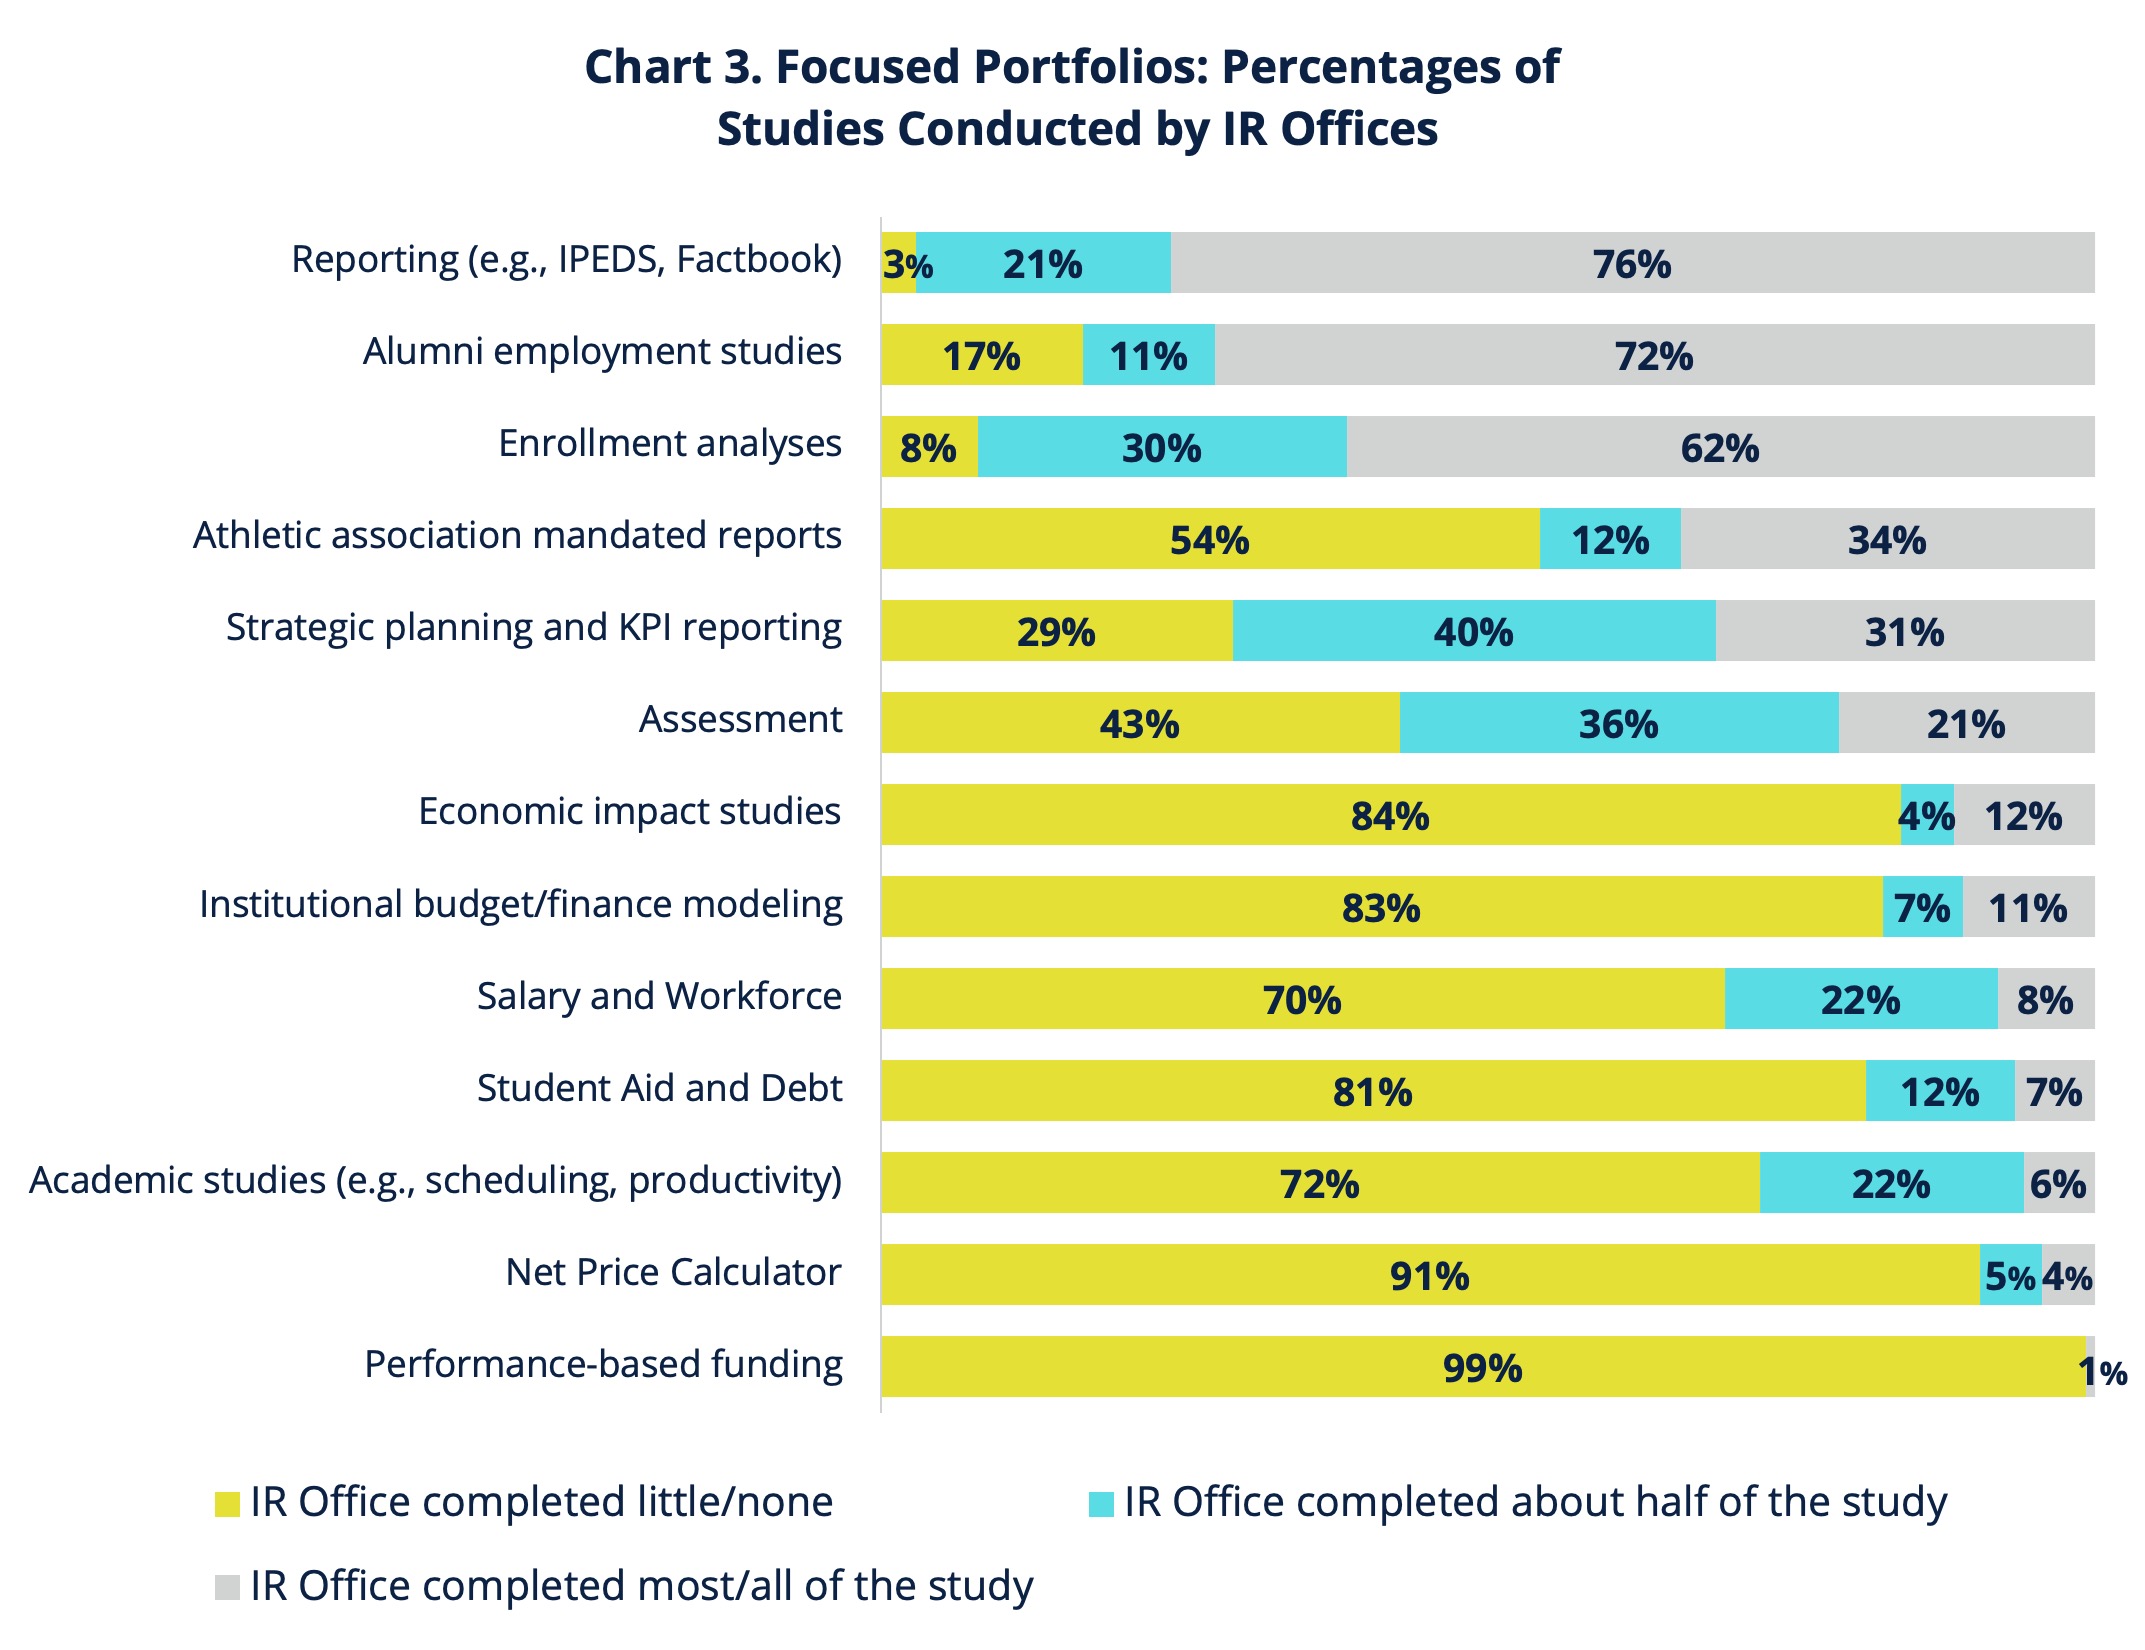
IR offices with focused portfolios of work complete most/all specific sets of studies (i.e., reporting, alumni employment inquiries, enrollment analyses) with little work on studies like student aid/debt, academics, and net price calculator (Chart 3). In other words, these IR offices focus on select sets of studies. Nearly one-third (31%) of IR offices are in this category.
More than half of IR offices in the focused portfolio cluster are from private not-for-profit 4-year institutions (57%) compared to 15% from public 2-year institutions and 28% from public 4-year institutions.
Cluster 3: Limited Portfolios of Work
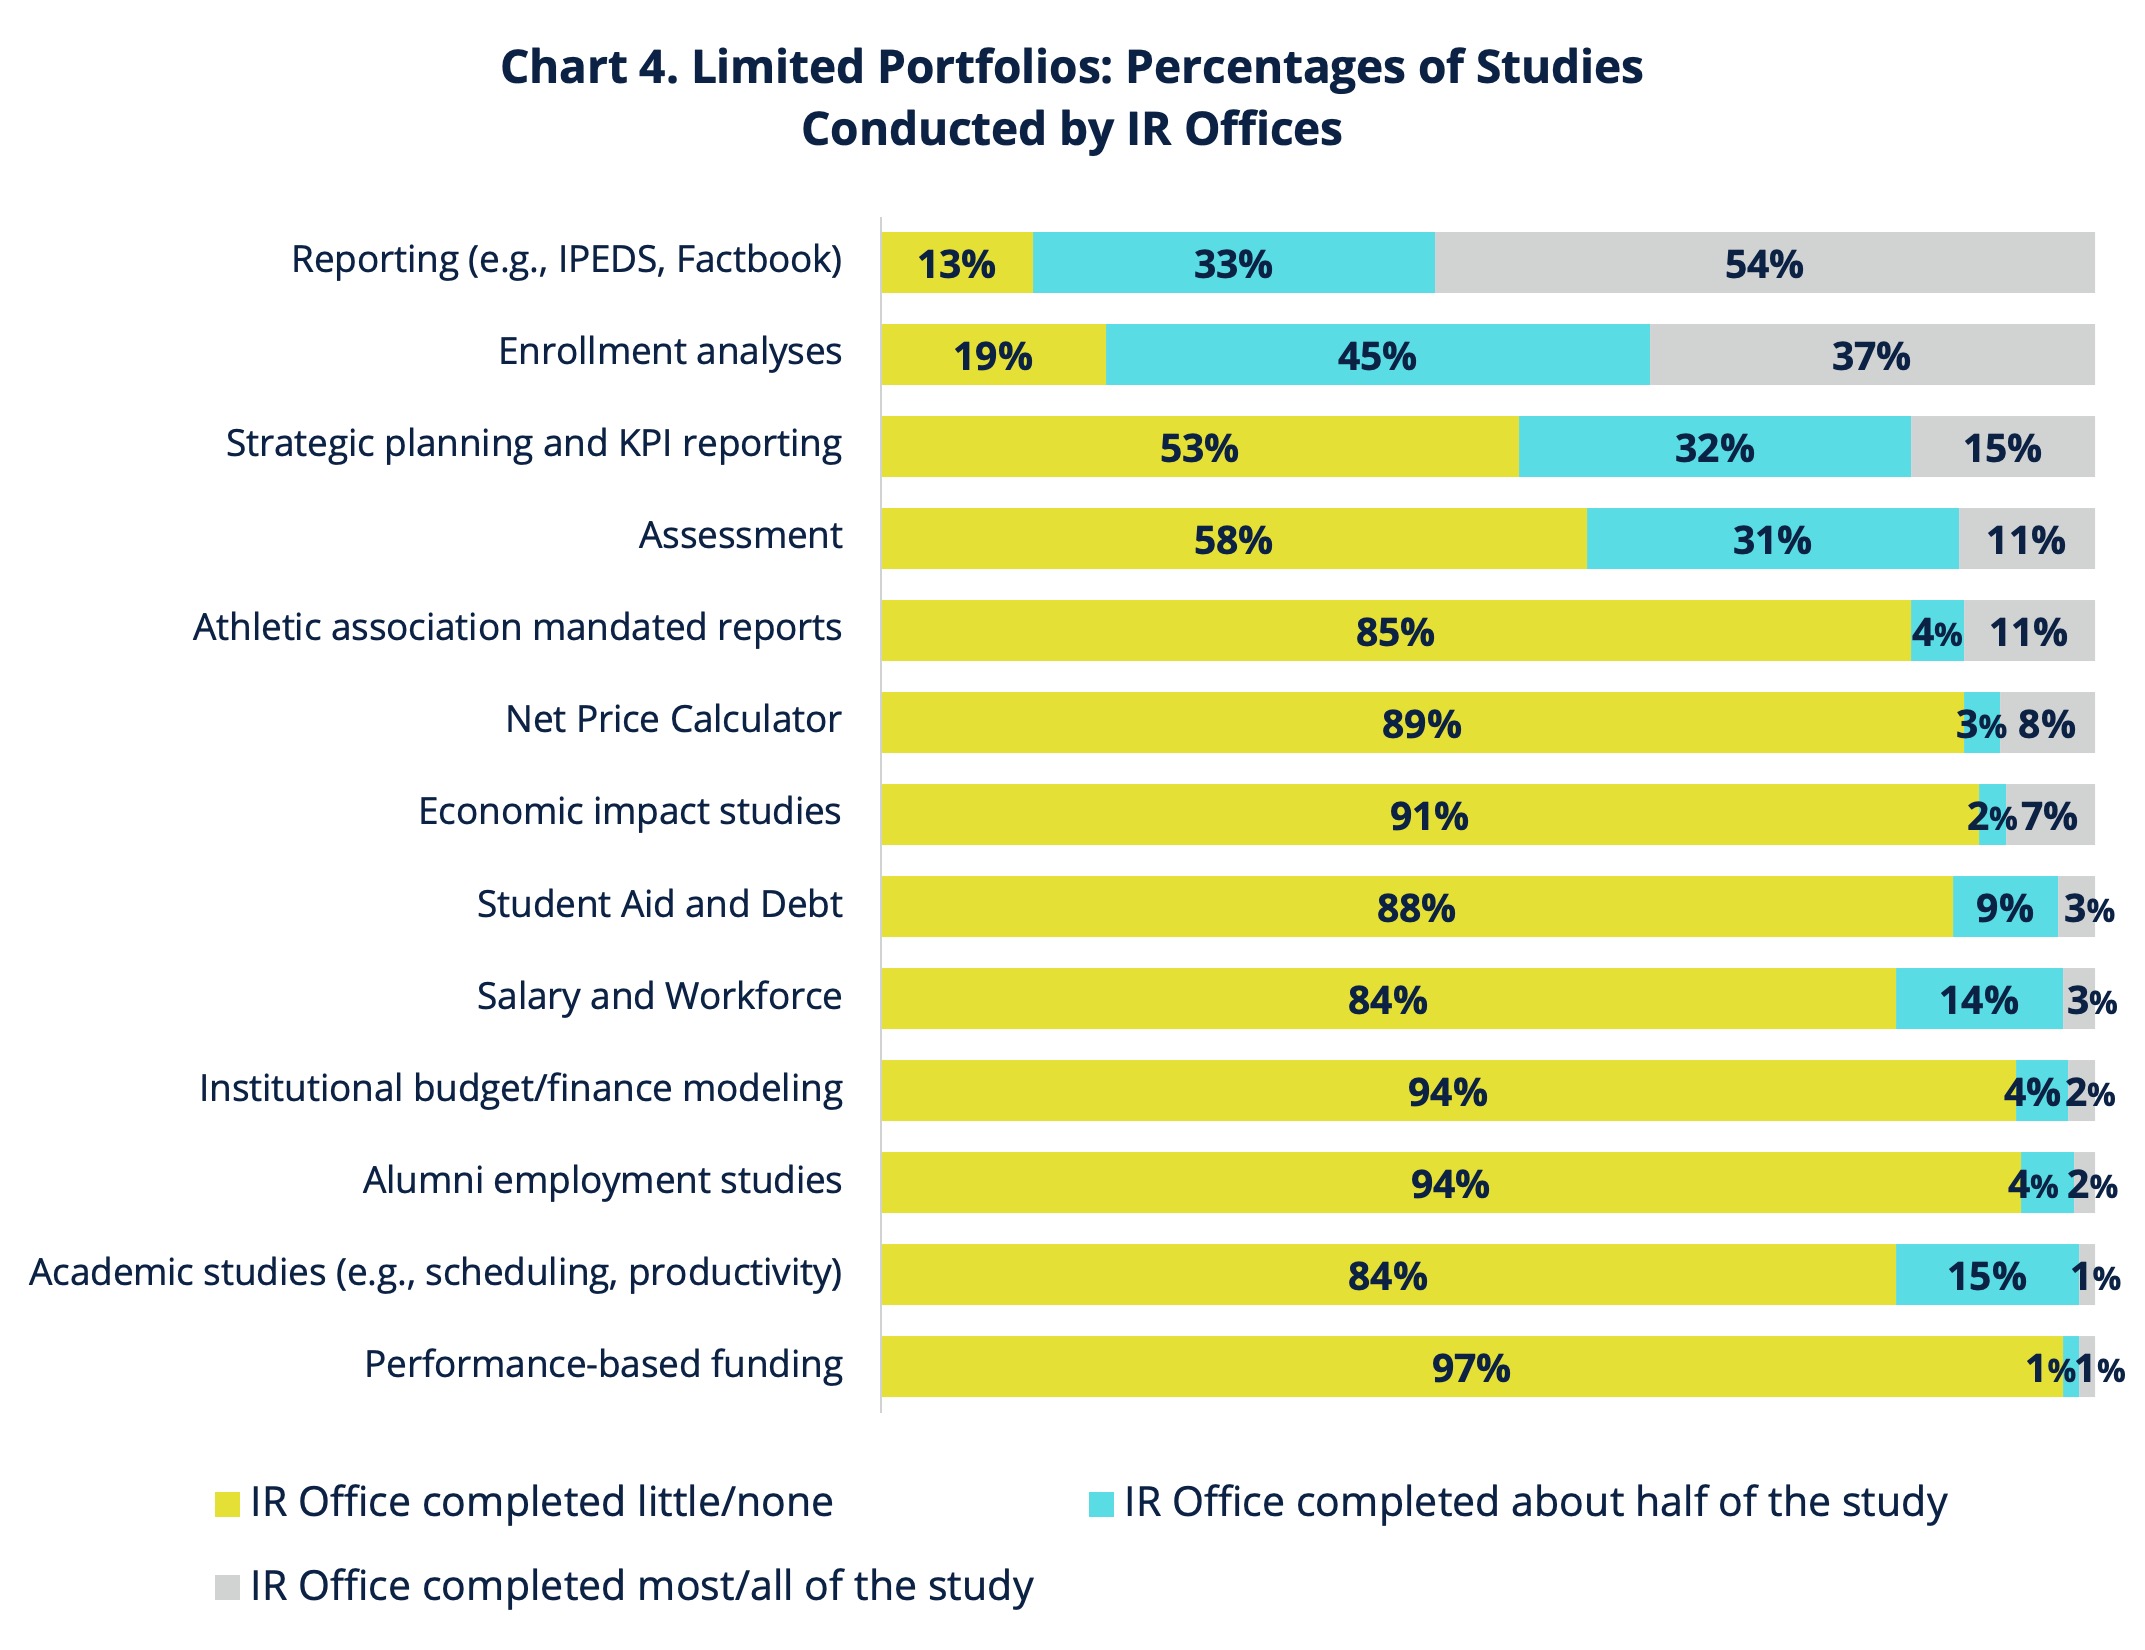
IR Offices with limited portfolios of work make up more than half (53%) of the offices represented in the survey. Their portfolios are primarily related to reporting activities and enrollment analyses (Chart 4). They do little work on studies, such as alumni employment, institutional budget/finance modeling, or performance-based funding.
More than half of the IR offices in the limited portfolio cluster (54%) are from private not-for-profit 4-year institutions, compared to 22% from public 2-year and 25% from public 4-year institutions.
Methodology
The 2018 AIR National Survey of IR Offices attempted to survey IR office leaders at more than 3,000 postsecondary degree-granting institutions. Institutions of all sectors, types of control, and sizes were included in the sample. In total, responses represented 1,167 institutions, and 566 of those institutions completed the survey in full. To ensure comparable results, incomplete responses are excluded from this report. In addition, responses from for-profit institutions, administrative units, international institutions, private not-for-profit 2-year institutions, and institutions in U.S. territories are excluded due to low response rates.
This Report
The findings presented in this report are based on 543 responses that represent U.S. postsecondary, degree-granting institutions at public 4-year, public 2-year, or private not-for-profit 4-year institutions.
- Swing, R. L., Jones, D., & Ross, L. E. (2016). The AIR national survey of institutional research offices. Tallahassee, FL: AIR. https://www.airweb.org/nationalsurvey
- See methodology section at end of this report for more information.
Related Content
2018 AIR National Survey of IR Offices: Topic Briefs