Average IR Office Staff FTE by Total Institutional Enrollment
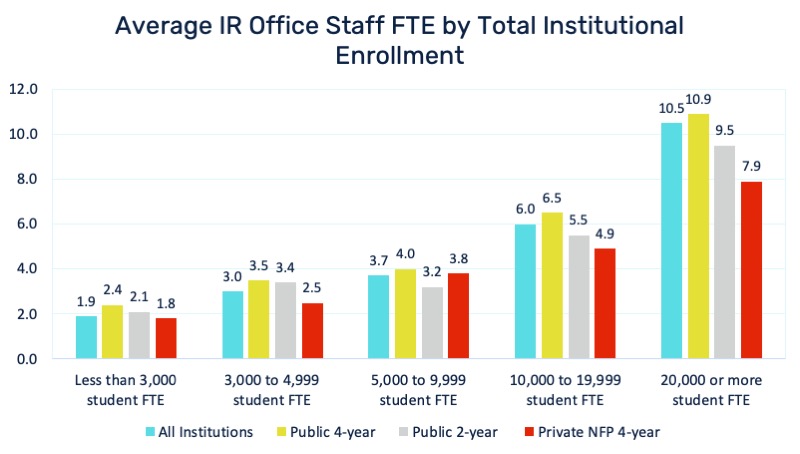
Institutional data capacity is largely dependent on the IR Office. And the amount of information that an IR Office can produce is strongly tied to the size of that office. So, what drives the size of the IR Office? In short, the size of the institution. From the 2021 AIR National Survey of IR Offices, we find a strong correlation between institutional enrollment and IR staff FTE (full-time equivalent). In this chart, we show how the IR office staff increases, regardless of major institutional sector, as institutional enrollment grows.


Long Description
Average IR Office Staff FTE by Total Institutional Enrollment
| Total Institutional Enrollment | All Institutions | Public 4-year | Public 2-year | Private NFP 4-year |
|---|---|---|---|---|
| Less than 3,000 student FTE | 1.9 | 2.4 | 2.1 | 1.8 |
| 3,000 to 4,999 student FTE | 3.0 | 3.5 | 3.4 | 2.5 |
| 5,000 to 9,999 student FTE | 3.7 | 4.0 | 3.2 | 3.8 |
| 10,000 to 19,999 student FTE | 6.0 | 6.5 | 5.5 | 4.9 |
| 20,000 or more student FTE | 10.5 | 10.9 | 9.5 | 7.9 |
