Data Bite December 2018
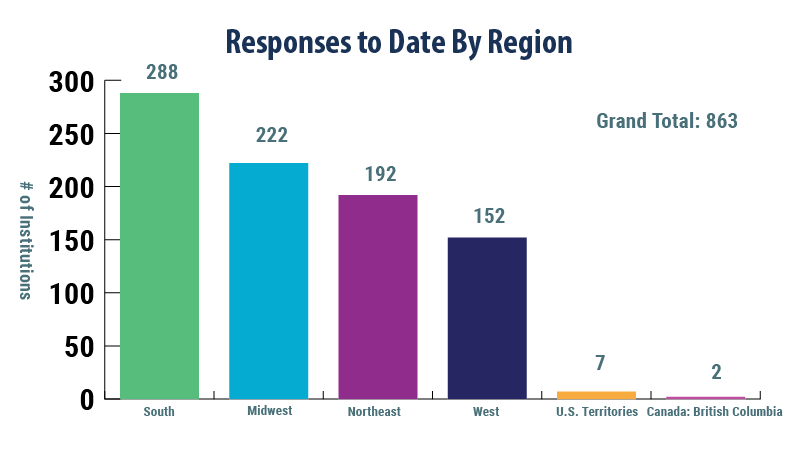
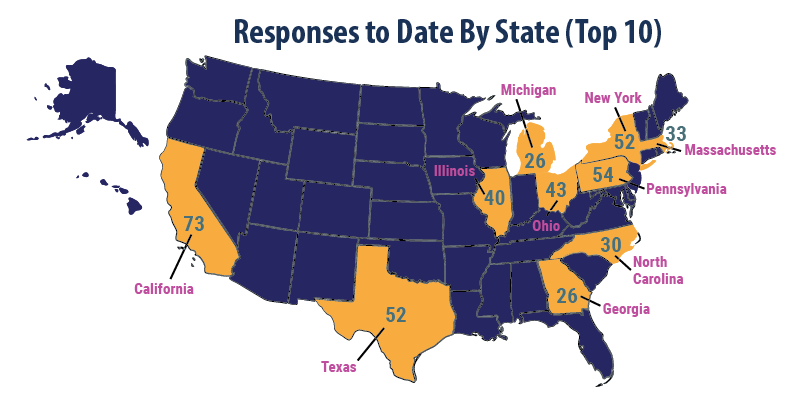
The 2018 National Survey of IR Offices provides a tool for internal reporting and comparison to peer institutions. To date, 863 have participated.
RESPONSES


REPORTING
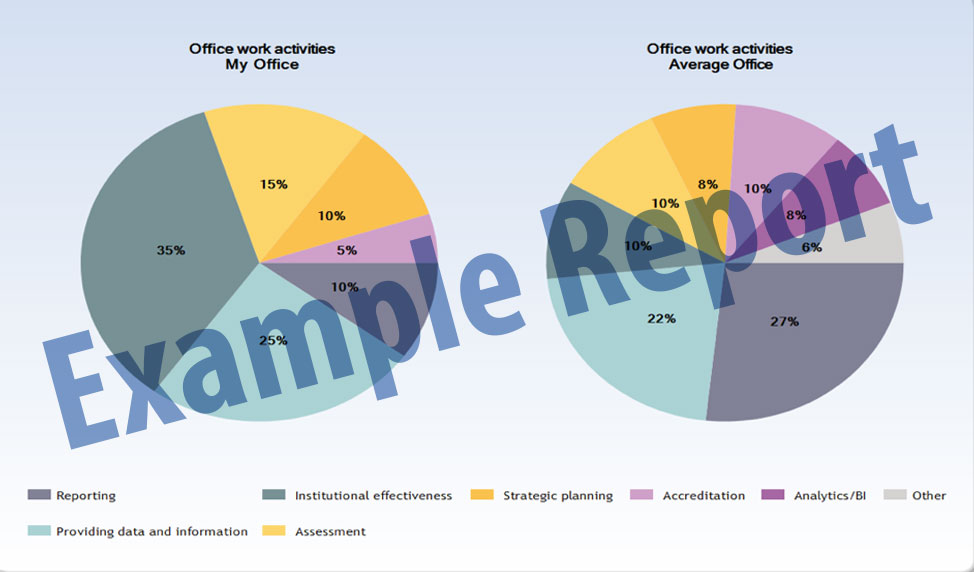
Participants who complete all required questions have access to a benchmarking tool to filter survey data based on sector or Carnegie Classification. Basic and longitudinal reports answer questions about the IR office, such as:
What is the average staff turnover rate?
What kinds of staff positions exist at peer institutions?
What types of work do my peers do?
How do staff spend their work time?
How have our staffing numbers changed over time?

EXPANDED REPORTING
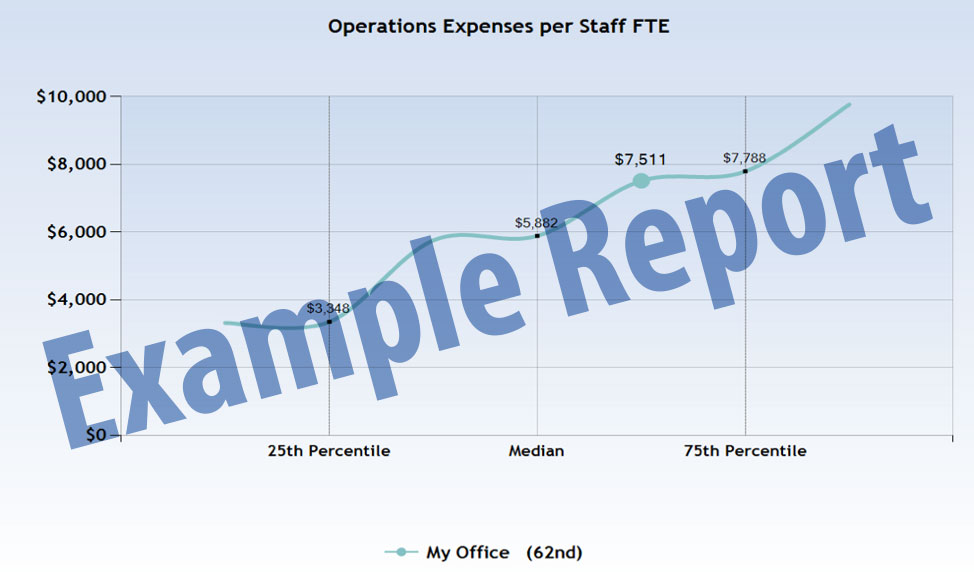
Participating institutions can upgrade to premium benchmarking to access advanced filtering that includes 26 dimensions, such as enrollment and region, and more sophisticated reports that answer questions about the IR office, such as:
How many staff do my peers have?
How do my staff expenses compare to my peers?
How much does the Director of IR earn?
Do we have sufficient professional development and operations resources?
In which divisions do my peers’ report?
How much time do my peers spend on information production?

Data collection is still underway. To learn more, participate, and contribute to knowledge about the field, visit airweb.org/nationalsurvey.
