Office Leader – Time Allocation
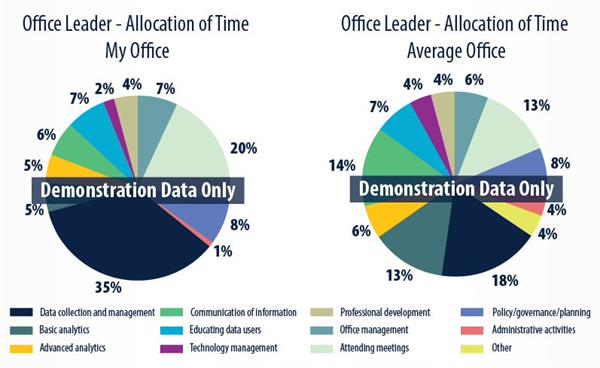
How do you spend your day-to-day time? Do your colleagues allocate the same time? The 2018 National Survey of IR Offices asked office leaders to estimate the percentage of their time to various activities. Using demonstration data from the National Survey of IR Offices, the chart below shows an IR office leader’s time allocation compared with the average of their peers. This IR director spends nearly twice the amount of time on data collection and management compared to their peers (35% compared to 18%), they spend half of their time communicating information compared to their peers (6% compared to 14%), and nearly twice the amount of their time in meetings compared to their peers (20% compared to 13%).
Which time allocation is best? Benchmarking doesn’t define best practices, but it can help you better understand your office’s work and organization. If this IR director wants to build a case for institutional data integrity (thus reducing their time managing or cleaning data), then these data might be the catalyst to convince senior leaders.

It’s likely those numbers vary widely by the number of staff in the office. The best way to understand how your office compares to peer offices is to create a benchmarking group and download the Basic Report from the National Survey of IR Offices. These data (and others) are free to those offices that participate. Complete the survey by July 30 to ensure your institution’s data are included in the national report. To learn more, please visit the National Survey page.
