Visualizing Fundable FTE by Location
Pensacola State College is comprised of multiple campuses and centers that serve students in Northwest Florida. To visualize the total Full-Time Equivalent (FTE) of each campus and center, the Office of Institutional Research developed a Tableau dashboard that tracks current/changes in fundable FTE by location and enrollment type.
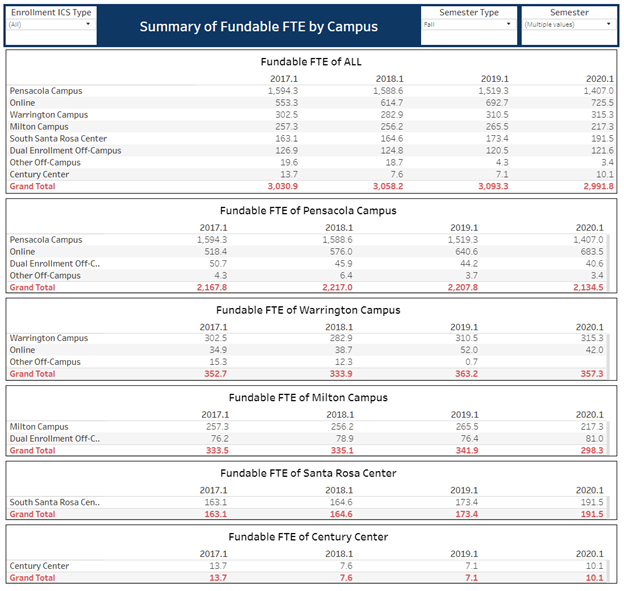
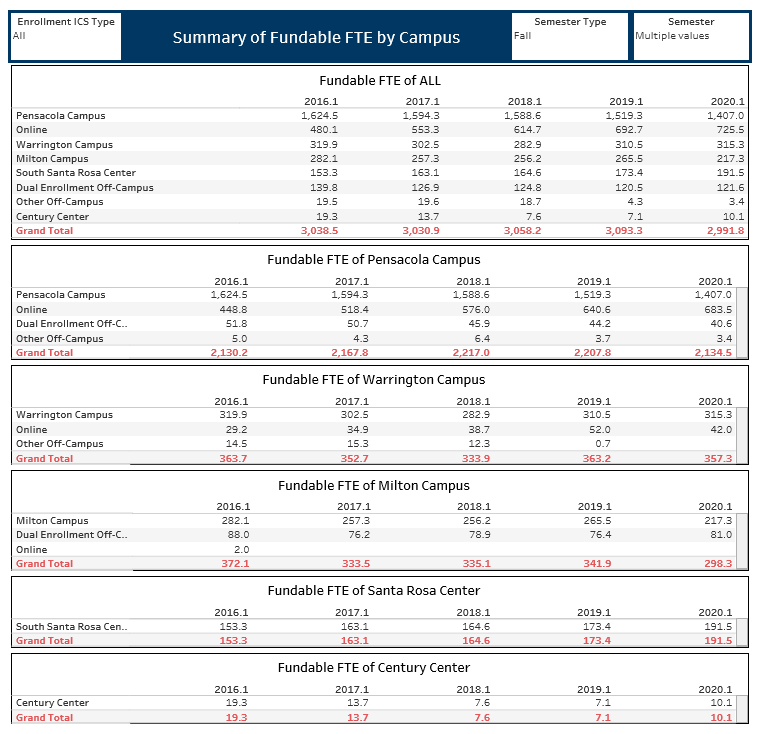
The dashboard calculates total fundable FTE (figure 1) and disaggregates by location of course: campus, center, online, dual enrollment off-campus, and other off-campus enrollment. An unduplicated FTE visualization allows administrators at Pensacola State College to compare the FTE generated by online and off-campus enrollment, simultaneously. The second component of the dashboard is a further breakdown of FTE by physical location, either campus or center, that displays all FTE generated to that campus or center (figures 4 and 5). In the individual views for the campuses and centers, total FTE is calculated for each campus and center and includes disaggregated by online or off-campus enrollment.
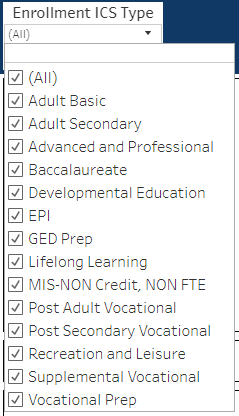
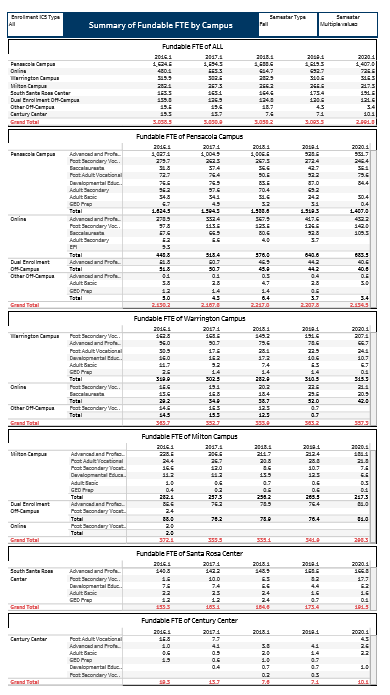
The dashboard has filters for the Enrollment ICS Type (figure 2), Semester Type (figure 3), and Semester. Additionally, the Enrollment ICS [Category] Type can be collapsed (figure 4) or expanded (figure 5) from the view of the campuses and centers. The availability of Enrollment ICS Type data allows for consideration and discussion rapidly recognizing a change of FTE over time.

Figure 1

Figure 2

Figure 3

Figure 4

Figure 5 (with enrollment)

Figure 5 (without enrollment)
