Infographics as an Alternative
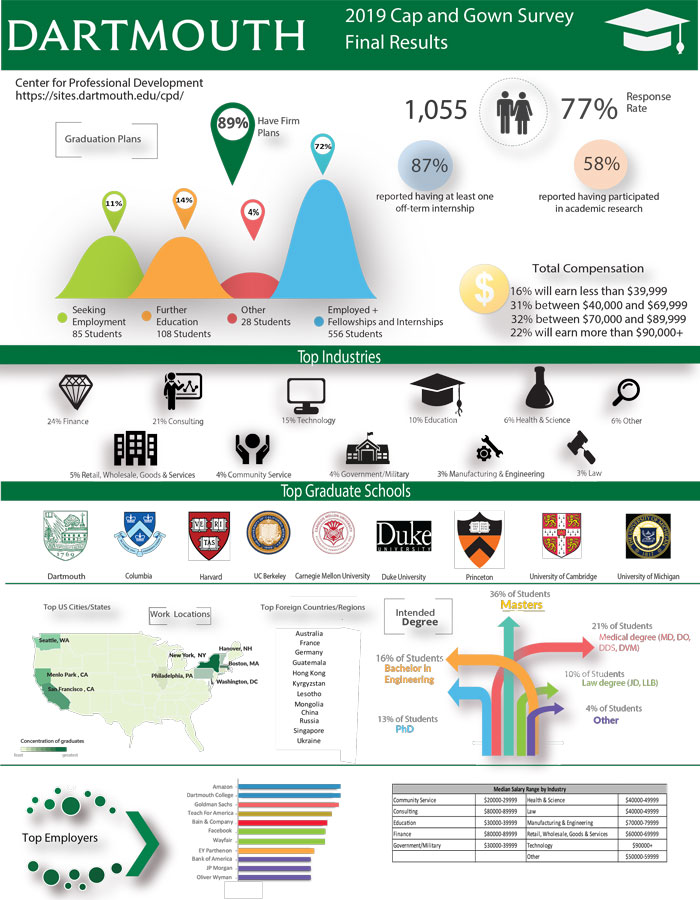
While the office routinely uses Tableau dashboards to share data with the campus community, there are also projects where an infographic may be a more visually compelling alternative. The office has invested in two tools for creating infographics as well as books to educate us more fully on graphic design principles and best practices.
- Tools: Adobe Illustrator and Piktochart. Illustrator is a vector graphics software which allows very detailed creation and manipulation of images while Piktochart offers various templates and more limited graphics editing.
- Books: Infographics for Dummies, Storytelling with Data, The Truthful Art: Data, Charts, and Maps for Communication
Two annual infographics that are reviewed and updated include First Destination results for Career Services (Illustrator) and a compilation of the Fact Book referred to as the Fact Card (Piktochart).


