Facilities & Operations Performance Management
In 2008, American University in Cairo (AUC) moved its main operations from downtown to New Cairo. With a beautiful campus designed to accommodate 5,500 full-time students and 1,500 faculty and staff, AUC’s $400 million, 260-acre campus is technologically advanced and environmentally sensitive. Offering state-of-the-art resources to students and faculty from around the world, the campus weaves Egyptian urban and architectural traditions into a modern campus and is designed to be accessible to persons with disabilities.
With AUC celebrating its centennial and putting more focus onto institutional effectiveness, the Vice President for Management & Operations requested a dashboard that would give her an overlook on running the operations of such a huge campus smoothly. She defined a set of KPIs and worked with her team in setting the targets for each. Then, she collaborated with the Business Intelligence Team on automating the reporting on these KPIs to be discussed in her area’s monthly meeting.
The dashboard has 2 sections:
- Campus Management Work Orders
- Water Consumption
We are looking forward to expanding the dashboard to include more about the Energy Consumption and Transportation.
The dashboard allows the VP and her team to:
- Compare their monthly performance to the target
- Identify gaps and analyze whether there has been a consistent performance management issue across time
- Know the year-to-date water consumption (Domestic and Treated)
- Compare year-over-year water consumption
The dashboard also allows the users to drill-through to more detailed dashboards and reports.
Work Orders
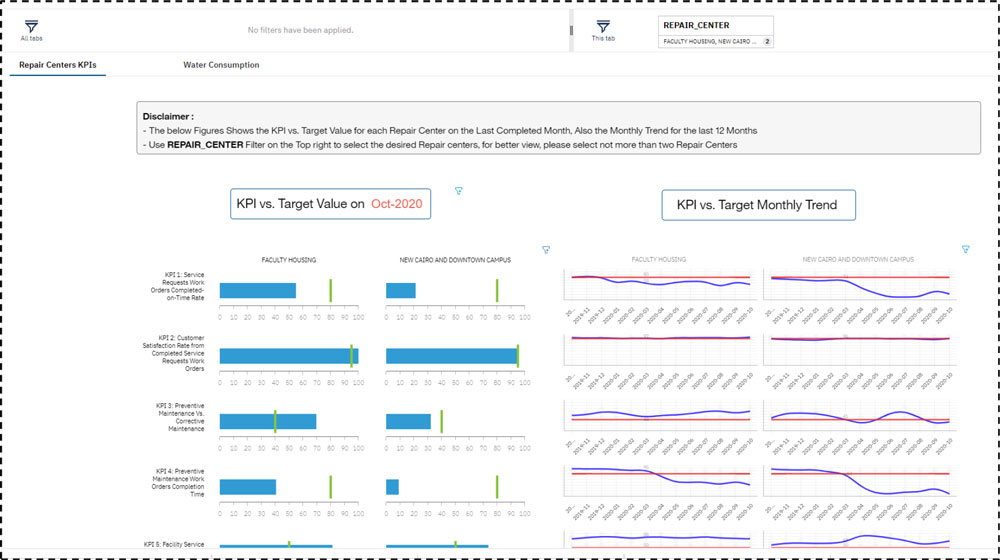
This provides a glimpse comparison of monthly performance to target with respect to 9 KPIs and a trend of monthly performance vs. target to help identify consistent performance gaps.
On the left, the chart shows the 9 KPIs and the current month performance in blue in comparison to the target in green. On the right, we have the trends over time. The trends allow the Facilities & Operations team to determine whether a deviation from the target is a consistent trend or a one-time deviation.
From here, the user can drill down to other dashboards that provide more details about the pending work orders of each repair center by initiating department, by number of delay tiers (e.g., less than 30 days, more than 30 days), by service type, etc.

Water Consumption
The second tab focuses on water consumption.

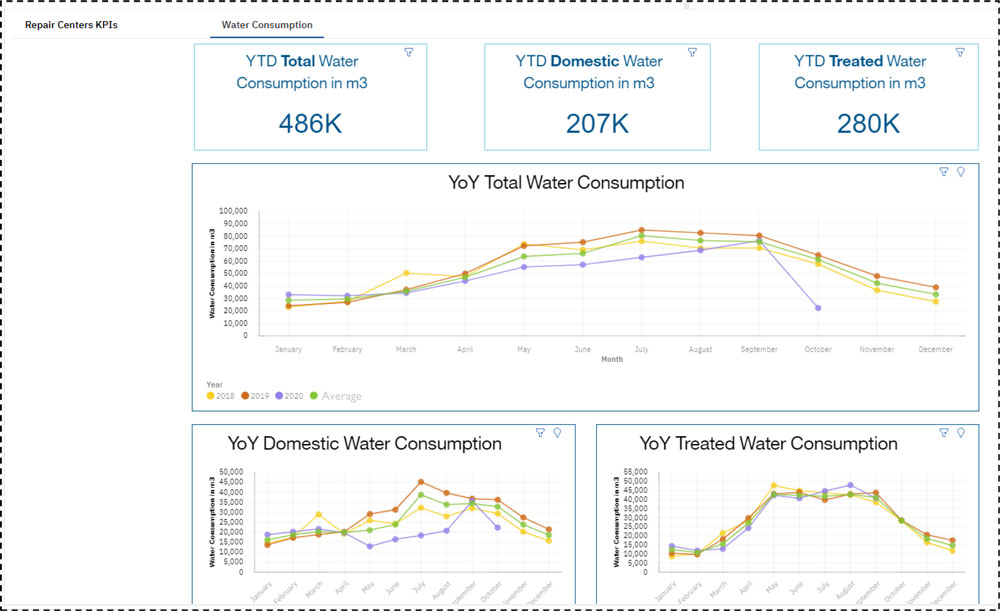
It shows the YTD Domestic, Treated, and Total Water Consumption. A year over year trend also helps the team assess whether we are on track with improvement toward sustainability and efficient resource management. A drill through button takes the user to a detailed dashboard with more information on the water consumption by buildings & gauges and by usage (e.g., Cooling Towers, Irrigation, Domestic use).
About AUC
AUC was founded in 1919 by Americans devoted to education and service in the Middle East. For its first 27 years, the University was shaped by its founding president, Charles A. Watson. Watson wished to create an English-language University based on the highest standards of conduct and scholarship, and to contribute to the intellectual growth, discipline, and character of the future leaders of Egypt and the region.
Throughout its history, AUC has balanced a strong commitment to liberal arts education with a concern for the region's needs for practical applications and professional specializations. Today, the University has 25 departments and institutes offering bachelor's, master's, and graduate diploma programs, in addition to 13 cross-discipline research centers. AUC offers 36 undergraduate, 44 master’s, and two Ph.D. programs rooted in a liberal arts education that encourages students to think critically and find creative solutions to conflicts and challenges facing both the region and the world.
