The Versatility of the XLOOKUP
LOOKUP, launched in 2019 by Microsoft, combines the functionality of multiple functions, including VLOOKUP and HLOOKUP, into a single source. It also offers the option to select a customized variable if no data are returned, allowing you to meet the unique needs of your project. Currently, the XLOOKUP is only available in Excel for Microsoft 365.
The structure of the XLOOKUP function is:
=XLOOKUP(lookup_value,lookup_array, return_array, [if_not_found], [match_mode], [search_mode]
The first three positions of the function are required, while those in brackets are optional. If you leave the if_not_found component blank, the traditional #N/A will be returned. The match_mode allows several options of matching, including exact match, exact match with the next largest or smallest item returned if none found, and a wildcard match. Lastly, the search_mode defaults to starting with the first item but allows you to select a reverse search, among other options.
To illustrate the usefulness of the XLOOKUP, let’s revisit our friends at Bayside High School.
XLOOKUP to enter a value
Figure 1 represents a list of students at Bayside High who have missing GPAs. There is a list of some student GPAs in Figure 2 that need to be added to the table in Figure 1. To accomplish this task, create an XLOOKUP statement to return the desired results.
Figure 1

Figure 2
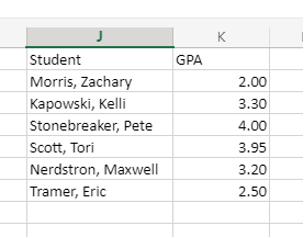
The lookup_value is going to be the student name in column B. This value will be in the lookup_array in column J and display the return_value in column K. If there is an error, “No GPA Available” should be returned. The resulting formula will successfully return:
=XLOOKUP($B2, $J$2:$J$7,$K$2:$K$7, "No GPA Available")
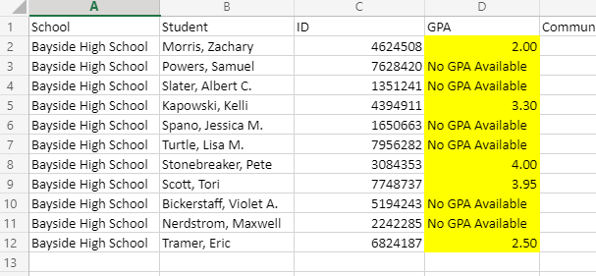
Figure 3 represents the output when the formula is applied to all cells, and Figure 4 shows the resulting output of the GPA or error message.
Figure 3
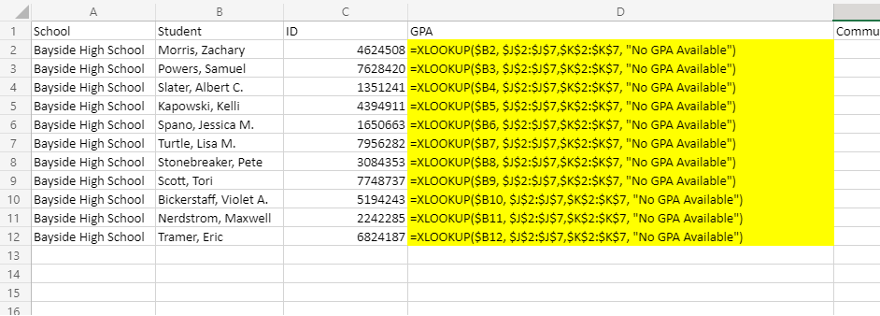
Figure 4
XLOOKUP to return a threshold value
Bayside High School encourages students to pursue community service projects and recognizes student accomplishments with an award status. The data contained in Figure 5 represent the minimum number of community service hours required to achieve an award status.
Figure 5.

In order to add the community service award level to our list of students in Figure 6, an XLOOKUP statement must be created that will function similarly to an HLOOKUP.
Figure 6.

The XLOOKUP formula to achieve this result is:
=XLOOKUP($E2, N1:P1,N2:P2, "No Award Status", -1)
In this example, the community service hours in column E are compared to the values that were displayed in the top row of Figure 5 and return the result in the second row. When the formula is applied to the desired cells, the output represented in Figure 7 is achieved. Figure 8 shows the resulting award levels that were added.
Figure 7

Figure 8

Two XLOOKUPS in a formula
You can use two XLOOKUP statements in a formula to achieve two-way results and maximize the benefits of this tool. In the Bayside High School example, data validation lists were created to select the student name and other variables for which there were data present. Figures 9 and 10 represent the values in the data validation lists.
Figure 9
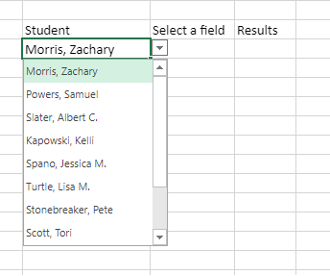
Figure 10
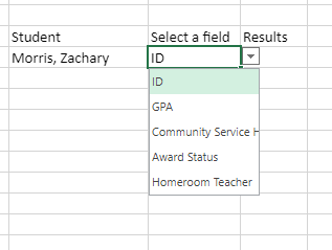
Figure 11
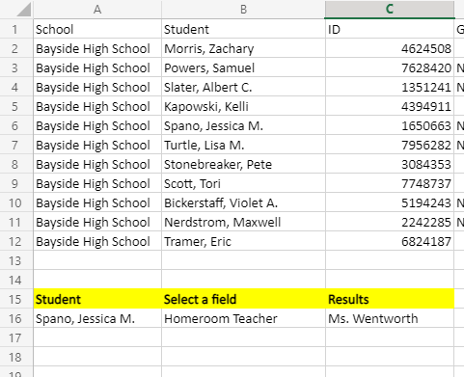
In order to see results for a selected student and field, a function with two XLOOKUP statements must be created to return the desired output like in Figure 11. One XLOOKUP is required to identify the student name and the second XLOOKUP is needed to identify the field and return array. For an example, suppose we want to see the homeroom teacher for Jessica Spano. The resulting XLOOKUP statement is:
=XLOOKUP($A16, B2:B12, XLOOKUP($B16, C1:G1, C2:G12))
Dissecting the equation, the value in cell A16 is sought in the lookup_array. The second XLOOKUP statement finds the value in cell B16 in the lookup_array and returns the associated value. Figure 12 shows that Ms. Wentworth is Jessica Spano’s homeroom teacher.
Figure 12

The preceding examples are only a few of the ways that the XLOOKUP can be used to maximize performance and efficiency in your data analysis if you are working in Excel in Microsoft 365. By combining the functionality of several features, the end user experience is greatly improved.

Dale Amburgey, Ed.D. is the Assistant Director of Institutional Research at Embry-Riddle Aeronautical University, where he concentrates on business intelligence, dashboard design, data utilization, and developing data governance frameworks. He has over 24 years of experience in higher education spanning institutional research, enrollment management, and operations.
