
Online Colleges and Universities: Are They Delivering on Diversity and Inclusion? A Recent Analysis from IPEDS Data
Although several studies have examined diversity and inclusion in higher education, they have largely overlooked online colleges and universities. Online education has become more popular due to the COVID-19 pandemic and is seen as an alternative to traditional classrooms. In fall 2020, 75% of undergraduates took at least one distance education course, and 44% exclusively took distance courses, with online enrollment increasing by 97% compared to fall 2019. The number of exclusively distance education students increased by 186% in 2020 compared to 2019, according to NCES.
Online education is believed to increase college accessibility and diversity by providing more flexibility for students with economic or scheduling constraints, attracting more mid-career and nontraditional students. However, according to Christopher Newfield and Cameron Sublett, online education may worsen racial disparity and fail to deliver basic skills to minority students. They suggest that until researchers develop ways to overcome these disparities, minority students who lack basic skill proficiency should be carefully placed in online courses.
There are mixed results regarding the efficacy of online programs. Students enrolled exclusively in online courses were 15.8% less likely to earn associate degrees compared to fully on-campus students. The results were more noticeable for BIPOC students, where Black students are 18.1% less likely, Hispanic students are 17.8% less likely, and low-income students are 16.8% less likely to earn associate degrees. However, enrolling in some but not all online courses increases the likelihood of obtaining associate degrees.
Given this backdrop, I'm interested in comparing how colleges and universities that provide online-only programs are doing in terms of diversity and inclusion, as compared to those that offer both traditional and online programs.
The analysis includes admission and graduation rates based on various factors such as gender, race, and ethnicity, financial aid, PELL and other loan receipt status, as well as outcome measures like the 6-year overall graduation rate and the graduation rate for PELL recipients. The data was obtained from IPEDS Fall 2021 and compared across different types of institutions, including 2+ years public, for-profit, and not-for-profit private degree-granting organizations.
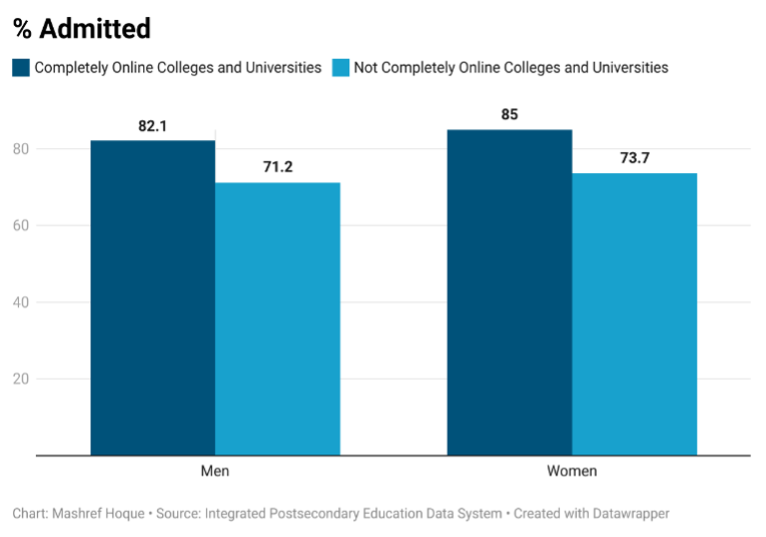
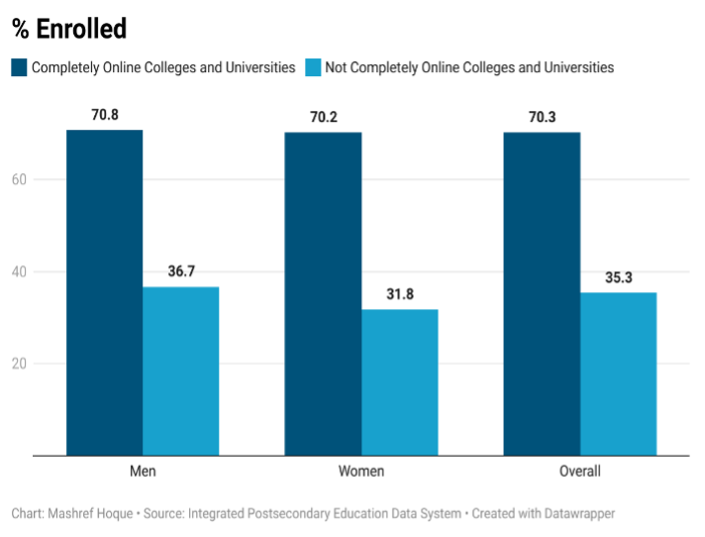
Higher admission and enrollment rate for both men and women in online institutions
Based on the analysis, we have found that online institutions tend to have higher rates of admission and enrollment for both men and women compared to institutions that do not exclusively offer online programs.
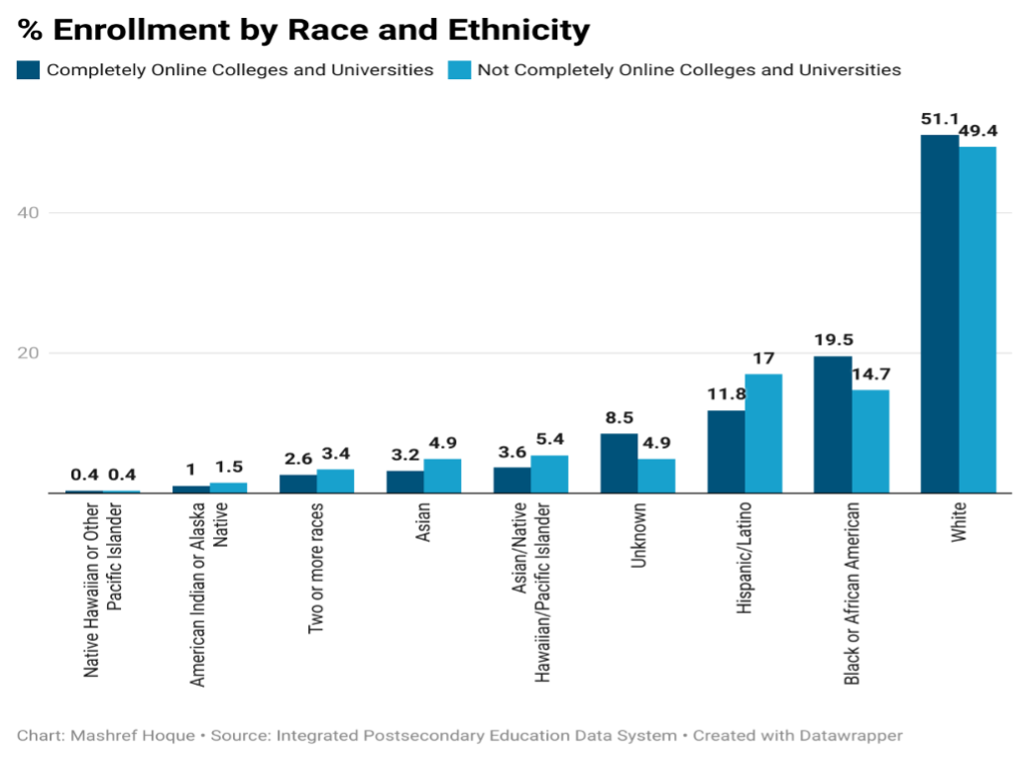
Mixed results for Enrollment in race and ethnicity
Except for White, Black or African American students, and Unknown student groups, online colleges and universities are not enrolling other racial groups in higher proportions compared to non-online institutions.
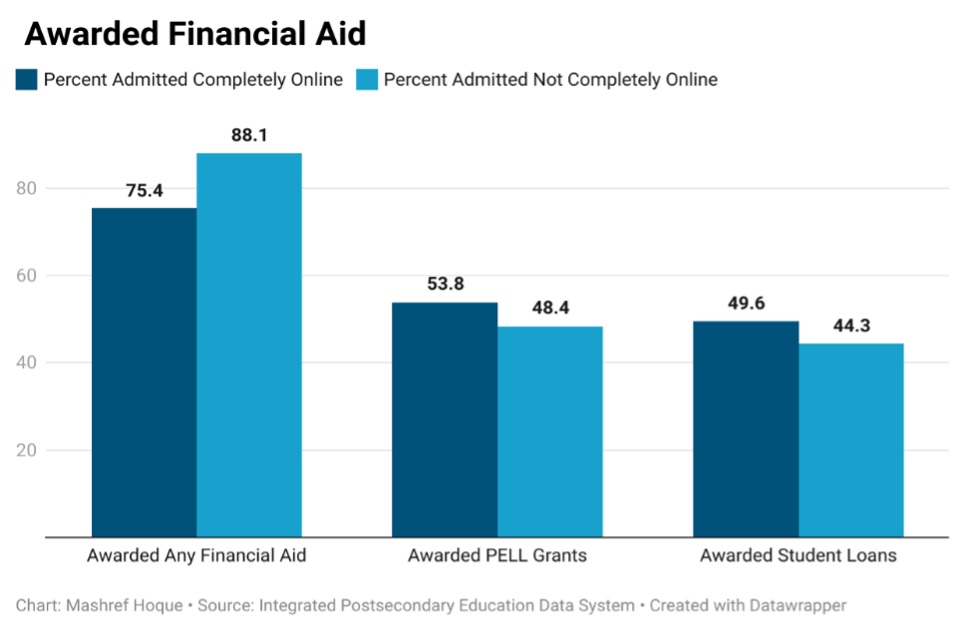
Online students are receiving more PELL and loans
Completely online college and university students are obtaining a greater proportion of PELL and loans to fund their degrees in comparison to non-online institutions, where PELL and loans are obtained. However, a larger percentage of non-online college and university students receive some form of financial assistance when compared to fully online institutions.
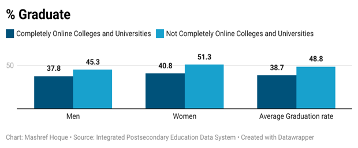
Lower graduation rates in online institutions
While we observed a higher percentage of admissions and enrollments in fully online colleges and universities, these institutions’ graduation rates are not on par with their non-online counterparts.
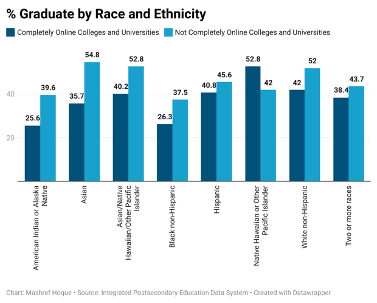
This is also true for graduation by race and ethnicity except for Native Hawaiian or Other Pacific Islander online students.
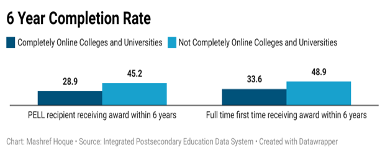
Lower outcome for online students
Outcome measures show that both first-time, full-time, and PELL recipient online students have lower completion rates compared to their counterparts who do not take courses completely online.
Though online colleges and universities have higher admission and enrollment rates, their degree completion rates are lower compared to the students who attend traditional programs. Previous research has also shown that students who solely take online courses are less likely to obtain associate and bachelor degrees. Therefore, a thorough study should be conducted to identify the reasons for this trend and recommend policies to improve outcomes for online institutions.
 Mashref Hoque is currently working as Business Analyst II in the Systems Intelligence and Data Analytics Department at the University of Nebraska at Omaha. Previously he worked as a Business Intelligence and Reporting Analyst at Weber State University. He earned his MA in Financial Economics from Bowling Green State University, Ohio. He can be reached at mhoque@bgsu.edu.
.
Long Description
% Enrollment by Race and Ethnicity is a bar chart comparing enrollment of students at completely online colleges and universities with not completely online colleges and universities. This information is included in tabular format below.
| Race Ethnicity | Completely Online | Not Completely Online |
|---|---|---|
| Native Hawaiian or Other Pacific Islander | 0.4 | 0.4 |
| American Indian or Alaska Native | 1 | 1.5 |
| Two or more races | 2.6 | 3.4 |
| Asian | 3.2 | 4.9 |
| Asian/Native Hawaiian/Pacific Islander | 3.6 | 5.4 |
| Unknown | 8.5 | 4.9 |
| Hispanic/Latino | 11.8 | 17 |
| Black or African American | 19.5 | 14.7 |
| White | 51.1 | 49.4 |
Awarded Financial Aid is a bar chart comparing the amount of students admitted with aid at completely online and not completely online colleges and universities. This information is included in tabular format below.
| Awarded Financial Aid | Percent Admitted Completely Online | Percent Admitted Not Completely Online |
|---|---|---|
| Awarded Any Financial Aid | 75.4 | 88.1 |
| Awarded PELL Grants | 53.8 | 48.4 |
| Awarded Student Loans | 49.6 | 44.3 |
% Graduate is a bar chart comparing graduation rates of male and female students at completely online and not completely online colleges and universities. This information is included in tabular format below.
| % Graduate | Completely Online | Not Completely Online |
|---|---|---|
| Men | 37.8 | 45.3 |
| Women | 40.8 | 51.3 |
| Average Graduation rate | 38.7 | 48.8 |
% Graduate by Race and Ethnicity is a bar chart comparing graduation rates of students at completely online and not completely online colleges and universities. This information is included in tabular format below.
| Completely Online | Not Completely Online | |
|---|---|---|
| American Indian or Alaska Native | 25.6 | 39.6 |
| Asian | 35.7 | 54.8 |
| Asian/Native Hawaiian/Other Pacific Islander | 40.2 | 52.8 |
| Black non-Hispanic | 26.3 | 37.5 |
| Hispanic | 40.8 | 45.6 |
| Native Hawaiian or Other Pacific Islander | 52.8 | 42 |
| White non-Hispanic | 42 | 52 |
| Two or more races | 38.4 | 43.7 |
6 Year Completion Rate is a bar chart comparing 6 year completion rates of students at completely online and not completely online colleges and universities. This information is included in tabular format below.
| Student | Completely Online | Not Completely Online |
|---|---|---|
| PELL recipient receiving award within 6 years | 28.9 | 45.2 |
| Fill time first time receiving award within 6 years | 33.6 | 48.9 |