
Using Tableau Data Management to Simplify Ongoing Processes
Data Management is a suite of features designed to help organizations manage Tableau content and data assets within Tableau Server and Tableau Cloud environments. As of September 16, 2024, Data Management is integrated into specific licensing editions, namely Tableau Enterprise and Tableau+.
The suite is built upon three primary pillars:
- Tableau Catalog: Enhances data discovery, trust, and lineage by providing visibility into the metadata and relationships of data assets.
- Tableau Prep Conductor: Facilitates the automation and monitoring of data flows to ensure data readiness.
- Virtual Connections and Data Policies: Provides a centralized, secure access point for data, where row-level security (RLS) is enforced at the connection level.
Data professionals in IR and similar roles throughout higher education are increasingly being asked to assume more technical roles. Our team in Enrollment Management and Student Success (EMSS) Research and Analytics at Miami University has assumed responsibility for blending and refreshing data from our student-information system, CRM, financial-aid management, and career-services platform to produce critical, up-to-date information for key stakeholders as we approach our official census. Furthermore, Miami is about to undergo a comprehensive reconceptualization of data governance across the University to facilitate timely and organized data-informed decision making. Fortunately, Miami obtained the Data Management suite through Tableau that can provide benefits beyond the data visualizations we all know and love. Our purpose here is to demonstrate some of the ways we are currently deploying Tableau Prep Conductor to automate regular refreshes and emphasize the Virtual Connections and Policies feature that can be deployed to ensure everyone has access to the data they need.
Tableau Scheduler
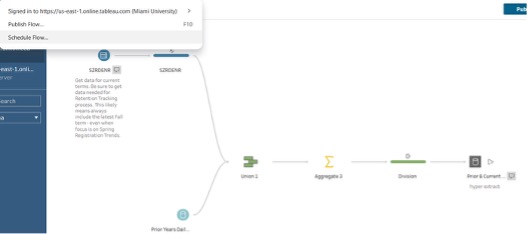
So far, most of our work within Tableau Data Management has involved scheduling recurring processes that combine data from multiple sources. One example is the process below, in which a daily enrollment snapshot is extracted, added to similar snapshots from previous years, and integrated with data from census and other online forms. Tableau Prep is a wonderful tool that allows us to streamline the process with multiple SQL queries alongside standing data sources. However, manually running multiple flows to build the end data source would take considerable time and need to be conducted early every morning to ensure data is available for EMSS leadership.
Fortunately, scheduling flows within our data management package is a relatively simple process. First, select “schedule flow,” which will publish the flow to Tableau Cloud and open the scheduler.
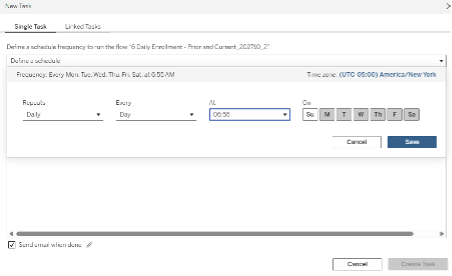
Once published, a new schedule can be set using the “Create New Task” feature. A new schedule can be set for the flow to run at any day or time and will be run pending server resources and errors. This specific flow is scheduled to run at 6:55 a.m., six days a week, with an email sent to the owner of the flow to verify that the operation has run. Developing and deploying an automated flow has saved staff resources while also assuring data will be available every morning.
Virtual Connections and Data Policies
Virtual Connections and data policies represent a centralized approach to data management and security within the Tableau ecosystem. Controlled through the Tableau Data Management license, these features shift the locus of control for data access and security from individual workbooks or data sources to a single, shareable connection layer. This is made possible by the introduction of connection-level row-level-security (RLS) through data policies within Tableau Virtual Connections. RLS ensures that security rules are applied consistently across all downstream content including workbooks, prep flows, and data sources, which decouples content-level permissions from data-level access. As a result, administrators can reduce data proliferation and maintain data sources more easily. For users, it provides a curated, trusted, and secure path to organizational data.
To understand the architecture of virtual connections, it is important to define the key components involved. As mentioned earlier, Virtual Connection is a shareable Tableau content type that provides a centralized access point to data across multiple databases. A Connection refers to the server name, database, and credentials used to access data. A Data Policy is a filtering mechanism applied to tables within a virtual connection to enforce row-level security. Within this structure, the Policy Table is the specific entity being filtered, while the user Table maps policy columns to user-specific values, such as matching a user ID to a college or department. Finally, a Policy Condition is simply a Tableau calculation or expression evaluated at query or run time, where rows are displayed only if the condition or conditions specified in the expression evaluate to true.
A Step By Step Example
In this example, we use a higher education sample dataset obtained from Tableau Public ( Sample Data | Tableau Public). The dataset contains 3,913 records and nine variables, representing donor gift activity and related attributes. Each row corresponds to an individual gift associated with a specific donor (identified by Prospect ID). The data includes information on the allocation and purpose of gifts, such as Allocation Subcategory, College, and Gift Allocation (e.g., scholarship or endowment); it also offers financial and temporal details, like Gift Amount and Gift Date, and donor-related context, including City, State, and Major, which may reflect the donor’s academic affiliation or area of interest. (Please note these do not represent actual colleges at Miami University.)
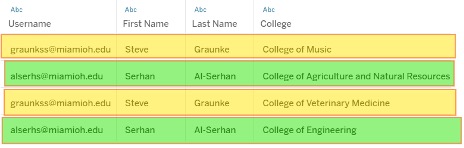
To demonstrate row-level security, we created a user table with two users: Steve Graunke and Serhan Al-Serhan. Each user is associated with a specific set of colleges—Steve Graunke with two colleges and Serhan Al-Serhan with a different set of two colleges—as illustrated in the figure below. This setup enables us to apply data policies that restrict access based on each user’s assigned colleges.
Below is a step-by-step guide on how to implement data policies in Tableau Virtual Connections.
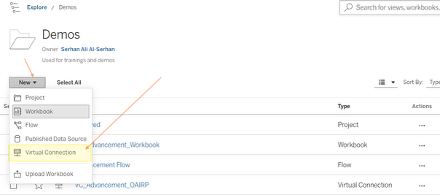
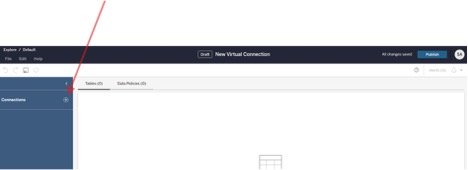
Step 1: Create a Virtual Connection
In Tableau Cloud (or Tableau Server with Data Management enabled), navigate to New and select Virtual Connection. This will open the Virtual Connection interface.
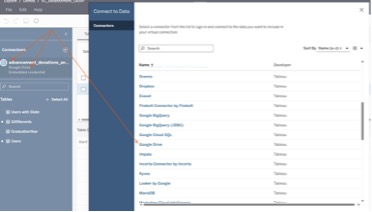
Step 2: Connect to Data
Once the Virtual Connection interface opens, click the “+” (Add Connection) button to connect to your data source. Configure the connection by selecting the appropriate server, database, and credentials.
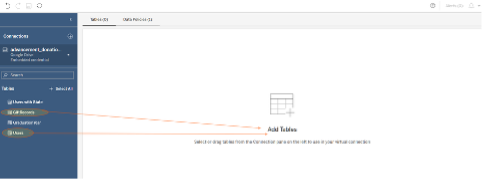
Step 3: Add Tables to the Workspace
After establishing the connection, drag and drop the required tables into the Virtual Connection workspace:
- The policy table (your main dataset—e.g., donations data)
- The user table (user-to-college mapping table)
Step 4: Define the Relationship Between Tables
Ensure there is a logical relationship between the policy table and the user table, typically based on a shared field such as College. This relationship enables filtering logic for row-level security.
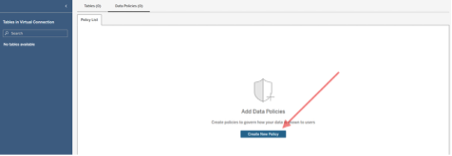
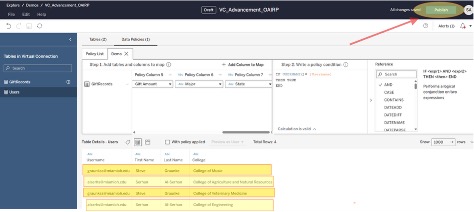
Step 5: Create a Data Policy
Navigate to the Data Policies section within the Virtual Connection and create a new policy.
- Select the policy table (e.g., donations dataset) as the table to secure.
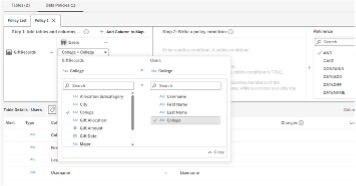
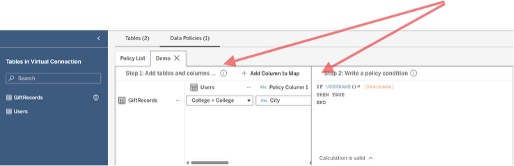
Step 6: Define the Policy Condition (Row-Level Security Rule)
Create a calculation (policy condition) that enforces row-level security. This condition typically:
- Matches the current user to the user table
- Filters rows where the user’s assigned colleges match the college field in the policy table
Example logic (conceptual): Show data where [College] matches the user’s assigned college(s) from the user table.
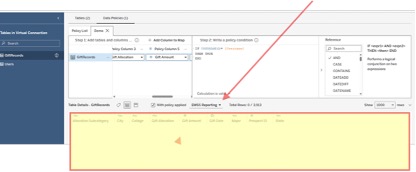
Step 7: Validate the Policy
Test the data policy by previewing results as different users (if possible) to confirm that:
- Each user only sees data for their assigned colleges
- No unauthorized data is visible
- Unauthorized user
- Authorized user
- Unauthorized user
Step 8: Publish the Virtual Connection
Once validated, publish the Virtual Connection. This makes it available as a centralized, governed data source for workbooks, prep flows, and other Tableau content.
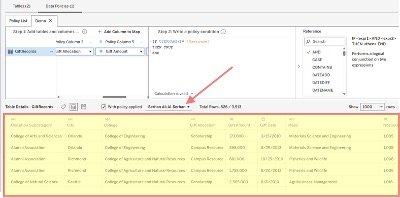
Step 9: Use the Virtual Connection in Reporting
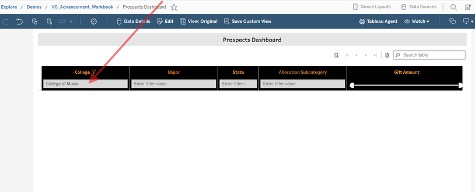
Connect Tableau workbooks or dashboards to the published Virtual Connection. All downstream content will automatically inherit the row-level security rules, ensuring consistent and secure data access across the environment. For example, while logged in as Serhan Al-Serhan, the user is only able to see rows associated with the two assigned colleges.
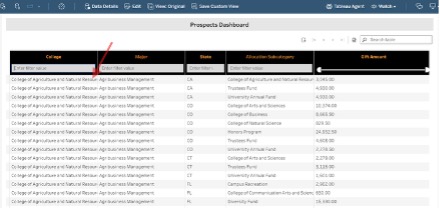
If the user attempts to access or search for rows associated with colleges other than those assigned to them, they will not be able to see or access those rows.
The Present and Future of Tableau Data Management at Miami
We at Miami still have a long way to go in our data management journey. The University is currently migrating to a new student information system that utilizes an object-oriented data model rather than the relational databases we have used for years. The transition will require our team to revisit several internal processes for obtaining and visualizing data. Combined with the opportunities presented by our aforementioned data governance transition, the need for tools that can effectively blend, organize, and secure data efficiently and effectively has never been more in focus. Fortunately, Tableau offers a wide variety of tools we can leverage to set policies and grant decision makers access to the data they need when they need it. We look forward to seeing how Tableau can contribute to both effective visualization and comprehensive data administration in the years to come.
 Steve Graunke serves as the Assistant Vice President of Research and Analytics within the Division of Enrollment Management and Student Success at Miami University. He has more than 20 years of experience in higher education data roles, which include advanced statistical analyses, reporting, and evaluation to drive data-informed decision making.
 Serhan Ali al-Serhan is the Director of Research and Analytics at Miami University with over 20 years of experience spanning higher education and state government, specializing in advanced statistical analysis, data management, and strategic decision support.