
Holistic Census Reporting: A Data Strategy in Five Acts
The 2020s have been transformative for Institutional Research (IR). In previous decades, training an IR analyst to support the fall enrollment census alone may have covered 80% of the job. Today, term snapshots are no longer a sufficient foundation. Campus leaders and government agencies increasingly demand answers that require connecting distinct data domains to tell each student’s whole story. Although the legal requirements and technical specifications vary across these requests, together they point to the need for a more comprehensive approach to census reporting. Our decision support teams need to invest in a resilient infrastructure addressing this need for holistic student journey reporting.
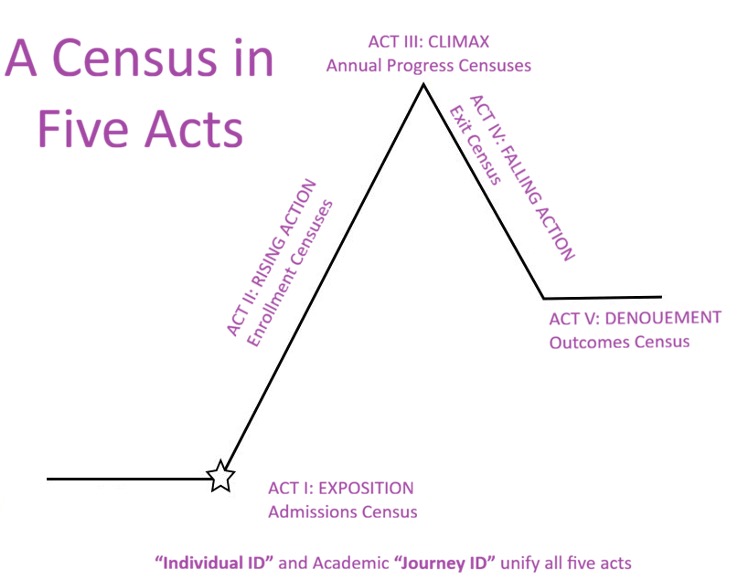
To get us closer to epic storytelling in data, I propose here an expanded census plan. This framework has been guiding NYU’s current migration from a term census Oracle database to our multi-domain reporting environment in CData. The plan is inspired by Freytag’s Pyramid, expressing census in five Shakespearean acts.
ACT I: Exposition in Admissions
Recent changes to federal admissions reporting requirements recently expanded beyond first time freshmen to include transfer and graduate student applications. These changes point to something broader: campus leaders need visibility into the admissions pipelines at all entry points. To meet this expectation, many institutions will benefit from replacing the fall undergraduate admissions census with a process that collects authoritative data on every applicant to every credential program in every term. We need a comprehensive admissions census, triggered as each program begins, identifying all applicants vying for roles in our campus play, establishing their backstories before they step onto our stage.
This census process launches the narrative by defining two unique keys: one identifier for each individual applicant and one for each academic journey they attempt. An academic “Journey ID” is an identifier that can follow a prospective student through changes in field or credential level as they navigate their path. In this framework, a Journey ID is an institution-defined identifier rather than an existing federal or industry-standard identifier. It changes only with a separate journey, like the pursuit of a second master’s degree.
The admissions census captures family background, demographics, prior academics,
initial financial aid offer details[1], and initial field and level of study: everything needed for compliance reporting, your advising teams, and your campus leaders when they come asking for admissions pipeline statistics.
ACT II: Rising Action of Enrollment
The term enrollment census has anchored IR since the 1970s. Because it is the most established census process, its rigid data-cleaning structures can serve as the operational model for our other acts. However your institution collects the enrollment census and chooses what data is enshrined within it: that process and infrastructure can be replicated across the other census acts outlined in this article.
For each student and Journey ID, the enrollment census captures current field of study and credential level, enrollment status, courses and credits attempted, prior cumulative GPA, current housing, citizenship, and home locations, and indicators of whether they are on track to graduate as expected.
ACT III: The Climax of Cost versus Progress
The federal aid year ending June 30 presents the official threshold for federal aid reporting. That climactic moment of compliance pressure and analytical tension needs its own census. Aligning reports across the federal COD System, NSLDS, FISAP, IPEDS, GE/FVT, and STATS is the goal of this annual collection.[2] These reports and systems reveal where the greatest scrutiny on higher education is happening: costs versus student progress. The metrics emerging from this cost and value data are where our institutional script plays out, revealing whether we achieve our institutional promises and affordability goals.
This annual census captures cost, aid, and completion statistics per Journey ID. Details include end of year CIP codes, aggregate bursar billing and aid for the year, and can also include critical non-financial student career markers, like year-end GPAs, and flags for participation in high-impact practices such as study abroad, internships, or research experiences. (For institutions like NYU, where the local fiscal year ends August 31, a parallel institutional snapshot must coexist with the federal aid year census.)
ACT IV: Falling Action as Students Leave Campus
When a student's on-campus narrative ends via graduation or discontinuation, we must log their final state. An annual exit census, timed around the June 30 cutoff, collects summative data rather than transactional details. It captures the final conferred CIP code, completion date, and exit status. Because this record integrates with Acts I through III, complex metrics regarding total net price, indebtedness, or cumulative time-to-degree can be dynamically derived by joining across the acts, preventing redundant or contradictory collection loops.
ACT V: The Denouement of Post-Graduation Momentum
In the final act, students step off the campus stage into their next chapter of life. By systematically integrating first-destination and exit surveys, National Student Clearinghouse files, and earnings data, we build a post-campus census into an open-ended outcomes registry. All former students can be followed through multiple accomplishments. Linking these outcomes back to the Student and Journey ID creates a dataset ready for high-stakes questions about the long-term return on our institution’s educational training. It allows us to inform prospective applicants about the outcomes they can expect from the careers of those who have gone before.
Tying the Narrative Together
Federal mandates will continue to fluctuate in courtrooms and negotiated rulemaking sessions. However, an IR office equipped with this unified, five-act framework remains insulated from both regulatory whiplash and changing internal reporting needs. These five acts joined by two keys allow nimble responses. Acts I, II, and IV together reveal your student success metrics. Acts II and IV populate College Scorecard cohorts. Acts I and V deliver a robust analysis of social mobility. Collecting census data through a unified framework built on consistent identifiers allows IR teams to spend less time developing one-off compliance solutions and more time producing analyses that inform institutional strategy.
[1] Capturing the initial accepted financial aid offer is necessary to sidestep historical reconstruction traps that made ACTS instructions so difficult to interpret. It is also vital for understanding the admissions market position of your institution. It should be expected to differ from the aid ultimately received by a student over the year, as enrollment levels, new award sources, and more will change many aid packages even one month into each first semester, and will ultimately be captured during Act III below.
[2] Acronym time! COD = Common Origination and Disbursement System, NSLDS = National Student Loan Data System, FISAP = FIScal operations report and Application to Participate, IPEDS = Integrated Postsecondary Education Data System, GE/FVT = Gainful Employment and Financial Value Transparency framework, and STATS = Student Tuition And Transparency System.
 David Vintinner, MS, MBA is
Assistant Vice President for Institutional Research at New York University, where he has for twenty-five years led initiatives in institutional analytics, data governance, reporting, and decision support. His professional interests include semantic data modeling, analytics governance, federal reporting, artificial intelligence in institutional research, and developing sustainable data ecosystems that improve organizational decision-making.
.
David Vintinner, MS, MBA is
Assistant Vice President for Institutional Research at New York University, where he has for twenty-five years led initiatives in institutional analytics, data governance, reporting, and decision support. His professional interests include semantic data modeling, analytics governance, federal reporting, artificial intelligence in institutional research, and developing sustainable data ecosystems that improve organizational decision-making.
.