
Less Frustration, More Concentration: 5 Quick Tips for Excel
Excel is a core tool for Institutional Research and Effectiveness (IR/IE) offices, but small friction points may disrupt your concentration and break your workflow. As it’s easy to miss useful features amongst the many updates, here are five tips that take only seconds to implement and can make spreadsheets much easier to validate, manage, and update.
Tip 1: Focus Cell
Pinpoint data within large spreadsheets by turning on “Focus Cell” to visually highlight the entire row and column of the selected cell with a different color.
(This does not change any formatting or colors in your spreadsheet.)
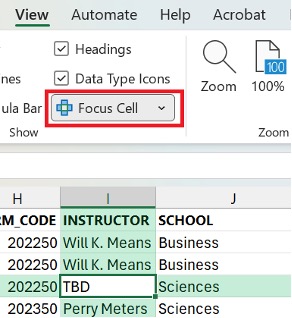
“Focus Cell” is generally found in the ribbon under the “View” menu, depending on the version in use.
You can set the “Focus Cell Color” to a color of your choice or just keep the default.
Tip 2: Name Cells for Clearer Formulas
To create more readable and reusable Excel formulas, define key cells or ranges with a specific name. This can reduce errors because named references remain consistent when formulas are copied or moved, while also making complex formulas easier to read, maintain, and validate.
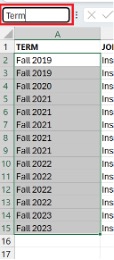
To define a name, just select the cell(s) and enter a name in the “Name” box located right above Column A. It’s that easy! (If you want to delete or edit a name, go to “Formulas > Name Manager.”)
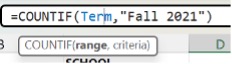
In the example screenshot below, cells A2:A15 are named “Term,” which can then be used in a formula in place of the cell range.
Before
=COUNTIF(A2:A15, “Fall 2021”)
After
=COUNTIF(Term, “Fall 2021”)
Tip 3: Get a Unique Count
Get a distinct count in Excel 365 without having to create a pivot table by stacking the UNIQUE function with COUNT or COUNTA. (Unlike Distinct Count in pivot tables, this will not count blanks.)
=COUNT(UNIQUE(A:A))

Tip 4: New Windows
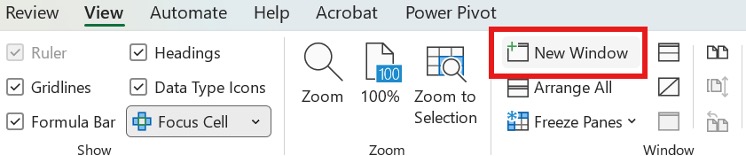
Tired of switching between worksheet tabs to compare data? Trying to make changes on different tabs in the same file? Go to “View” and “New Window” to open another Excel window for your file. It’s like having two copies of the file open at once, but they’re actually two views of the same workbook, so changes made in either window affect the same file.
The window state is saved with the file, so if you save it with two windows, it will re-open the same way.
Tip 5: Synchronous Scrolling
Synchronous scrolling is the most complex of these tips, but I’ve found it invaluable when comparing spreadsheets that have the same layout. “Synchronous Scrolling” can save a lot of time when validating or updating. As you scroll down or horizontally in one spreadsheet, the other scrolls with it, keeping the same view in both worksheets.
First, open both files. Make sure both worksheets are positioned at the same starting point and that any frozen pane settings match (for example, selecting A1 in both).
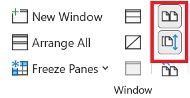
Next, click on “View,” and from the Window options, select “View Side by Side” (the top icon in the screenshot below). Select your files.
Synchronous Scrolling may turn on automatically when you select “View Side by Side.” If it doesn’t, click “Synchronous Scrolling” (the second icon below).
These tips may not be flashy, but they can make day-to-day work a little less frustrating, helping you stay focused where it matters.
 Hilary Carter is the Assistant Director of Business Intelligence at the University of Alabama at Birmingham. She oversees data architecture and modeling, reporting and dashboard development in support of institutional research, reporting, and analytics, with a focus on translating complex data for varied audiences.