
Speaking the Language of Decisions: KPIs from Base Camp to Summit
Every workplace sits atop mountains of data distributed across bespoke and commercially acquired systems. For executive leaders, achieving data-driven decision-making is an ongoing quest, in which they are deeply dependent on institutional analysts. We who support their questing sometimes react too swiftly to their questions, providing answers that leave both sides unsatisfied. To ensure our work has impact, we should center our work on commonly understood Key Performance Indicators (KPIs).
Decision supporters construct dashboards, metrics, and visualizations, forming a network of bridges reaching up the mountain to transform raw operational data into information and insights. The most effective bridges succeed not because of analytical skill, but because they effectively translate raw metrics into a language tailored to the decision-maker’s mind. Crossing that gap requires art as much as science, language as much as logic, and interpersonal trust as much as technical skill.
Tool-centric pride is misdirected. Every tool has weaknesses: Traditional printed factbooks lack agility; executive dashboards lack detail; deep detail reports drown among operational exceptions. Every solution can prompt follow-up questions that lead in a recursive circle. Success in decision support stems not from the tools, but from the shared understanding, like fresh data mountain air, breathed into the work. When analyst and decision-maker share the same core context, the resulting dashboard speaks exactly the language needed.
Context is key, and an effective Key Performance Indicator is aligned with strategic vision, is precisely defined, is transparently calculated, is referenced routinely, and is adapted as the institution evolves. Cultivating trusted KPIs on this data mountain requires an aligned team of climbers, each applying expertise at their specific elevation.
Reframing Decision Support Using Bloom’s Taxonomy
Bloom’s Taxonomy provides an ideal framework to understand how an organization processes information. Formulated by Benjamin Bloom to understand learning in an individual mind, this taxonomy also models how decision support steps interrelate simultaneously across an enterprise. Organizing our information strategy around this framework, focused on shared KPIs, enables everyone from teams of data creators to executive leaders to identify their role and relationship in decision making and to act together in confidence.
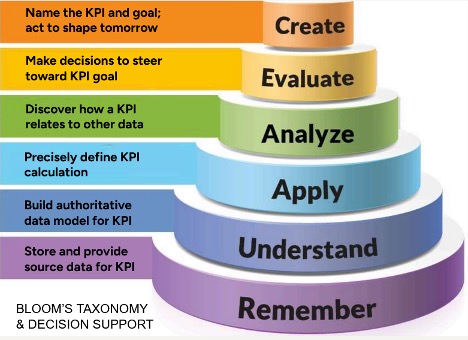
Creating Strategic Initiatives & Plans
At the apex, leadership defines what is important. They shine the light, plant the flag, and make decisions to reach it based on the reports they receive. Every KPI they ask for, be it a financial metric, student success goal, or marketing ratio, contains both the idea of what is being measured, and the goal of what that measure is supposed to be. Teams at lower elevations will align their daily efforts to these concepts, and should be expected to challenge or reject work that fails to move them. Leaders at this elevation, therefore, must remain clear regarding what is truly key, avoiding the campuswide distractions that come from mixing exploratory curiosities among the KPIs.
Evaluating KPI Progress & Impacts
At the evaluation level, analytical insights are synthesized into clear operational choices. Governance councils, deans, and senior administrators judge information quality and coalesce potential predictive data into actionable recommendations, giving leaders above the confidence to make informed decisions to move the KPI. They also translate leadership concerns into structured analytical tasks for teams below, so they can monitor the data landscape around a KPI, including data quality and data movement, predictions, and correlations that are reported to them.
Analyzing Hypotheses & KPI Drivers
Subject Matter Experts (SMEs) operate here using enterprise analytics and statistical packages. Work involves dissecting complex variables, testing hypotheses, evaluating trends, and making predictions. When analysts here perform original research or construct new data models in response to urgent moments or questions, they must pass the underlying logic down so the evolving data needs stabilize into repeatable reporting.
Applying Systematic Definitions & Dashboards
Here, curated KPIs are embedded into institutional infrastructure. Dashboards and standard reports are created at this elevation—the tree line on the mountain. Clear data definitions from above meet well-documented code from below, and both get applied as the KPIs are calculated and memorialized. Analyst questions and data quality alerts must both be addressed as each new strategic report is coded to most clearly present the authoritative KPI and its meaning needed in the moment.
Understanding Key Data & Its Governance
Institutional self-understanding occurs when raw data transforms into transparent, well-documented data sets and data sources. Transparency relies on business glossaries, report catalogs, shared code, and defined governance roles. SMEs on this level see data quality clearly, reacting to protect the need to consistently calculate KPIs above from the weediness of operational data below. Core institutional reports that change little over time—university factbooks and compliance filings—reside here.
Remembering Foundational Data Capture & Storage
At the base, work centers on data storage, cleaning, and integration. This layer establishes baseline institutional facts through census captures and authoritative data warehouses. Data professionals operating at this level are responsible for communicating back to data generators about what more is needed to ensure raw inputs support the KPIs rising to the summit.
Practical Steps for Today
To translate this taxonomy into immediate practice, data professionals can implement four core habits:
- Map Your Elevation: Identify the KPI driving your project, determine your taxonomy level, and assess what stakeholders above and below need from you.
- Elevate Documentation: Practice proactive documentation with your colleagues using the guideline: "If you see something, say something. If you DON'T see something, ask something".
- Reuse and Simplify: Avoid recalculating metrics available in lower tiers, and refrain from overcomplicating directives received from above.
- Shift Logic Down and Questions Up: Optimize organizational efficiency by pushing standardized calculations down to foundational layers while escalating exploratory findings upward for strategic review.
By anchoring decision support in precise KPIs, transparent governance, and deliberate cross-tier communication, institutional research and decision support teams eliminate friction, empower leadership to act, and cultivate a bloom of insights across our data mountains.
(Thank you to tips.uark.edu for the Bloom’s Taxonomy visualization that inspired the diagram above. The original publication of the Taxonomy can be found in Bloom, B. S., Engelhart, M. D., Furst, E. J., Hill, W. H., & Krathwohl, D. R. (1956). Taxonomy of educational objectives, handbook I: The cognitive domain. David McKay. [1])
 David Vintinner, MS, MBA, David Vintinner is Assistant Vice President for Institutional Research at New York University, where he has for 25 years led initiatives in institutional analytics, data governance, reporting, and decision support. His professional interests include semantic data modeling, analytics governance, federal reporting, artificial intelligence in institutional research, and developing sustainable data ecosystems that improve organizational decision-making.