
Beyond the Self-Study: Turning Accreditation Compliance into Year-Round Institutional Insight
At Pratt Institute, supporting accreditation prompted us to rethink what an institutional research (IR) office should leave behind after a self-study. The enrollment tables and graduation rates needed for a submission are also useful for program review and academic planning. By organizing recurring evidence in reusable Tableau dashboards, we began building a resource that programs could consult throughout the year. For IR offices facing repeated requests for the same measures, this approach offers a practical way to make accreditation work serve a broader purpose.
The familiar pattern is easy to recognize. One program requests several years of enrollment data. Another needs retention and graduation rates. A dean asks for similar information by student characteristics. Each request deserves attention, but producing separate tables can mean repeatedly assembling evidence that the institution already has.
Organizing Recurring Evidence
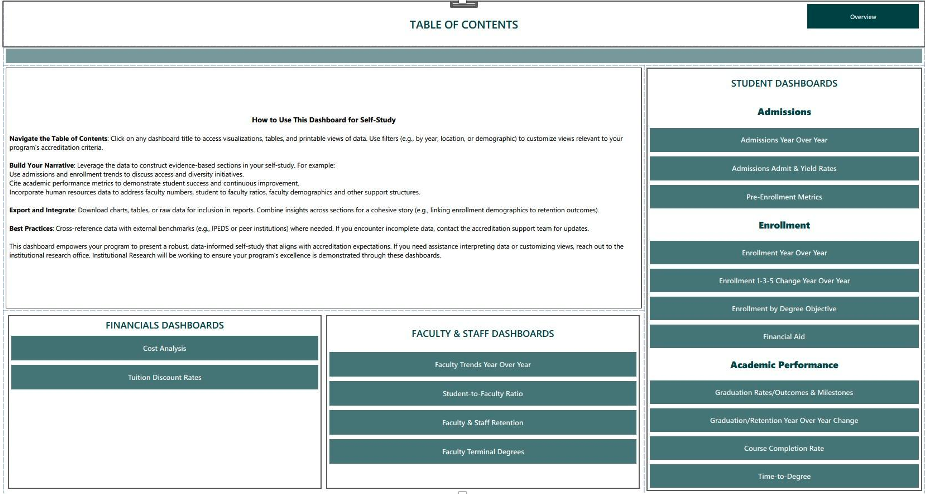
Our Self-Study Accreditation Program Review Dashboards bring commonly requested evidence into a shared environment. The table of contents organizes admissions, enrollment, academic performance, faculty and staff, and financial measures. Users can find admissions trends, course completion, graduation outcomes, faculty retention, and other indicators relevant to their program’s review.
Navigation alone is not enough. The opening page also explains how to apply filters, use evidence in a self-study narrative, export material, and consult external benchmarks where appropriate. It directs users to IR for help interpreting the data. This guidance connects the dashboard to the work a program actually needs to do (Figure 1).
Figure 1. The dashboard table of contents groups recurring self-study evidence and provides guidance on navigation, interpretation, and export.
Anticipating the Follow-Up Question
An enrollment table often leads to another question: Is the change concentrated among new students or continuing students? Does it differ by level or program? Which student populations account for the pattern? Designing for these questions can make a recurring report more useful without requiring a separate product for every variation.
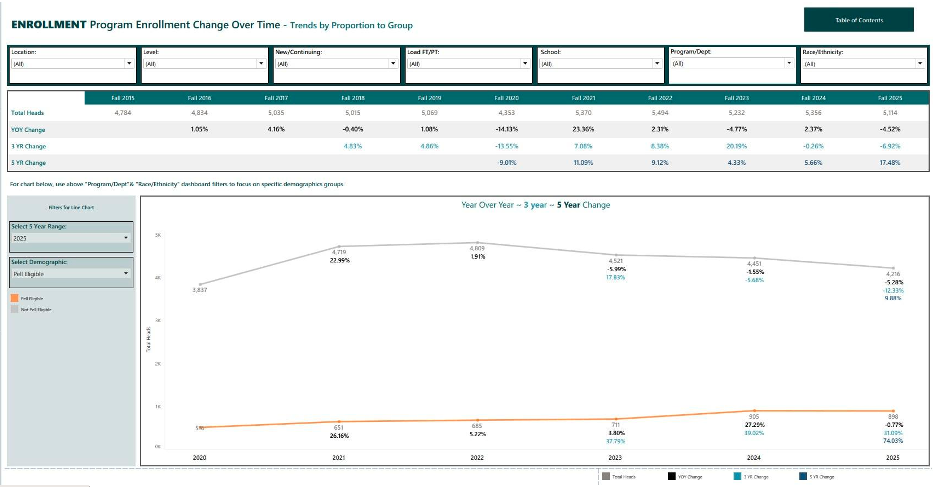
Our enrollment view combines a longitudinal table with filters for location, level, new or continuing status, full- or part-time enrollment, school, program, and race or ethnicity. It displays annual, three-year, and five-year changes, allowing users to examine the same enrollment history over different intervals (Figure 2). Admissions views similarly bring applicants, accepted students, deposits, and enrolled students together.
Figure 2. The enrollment dashboard combines a longitudinal table, annual and multiyear changes, and filters for program and student characteristics.
The point is to help users explore a question within a consistent reporting structure. A filter can narrow the population, but users still need to understand which population they selected and what comparison the display supports.
Using Accreditation to Clarify Definitions
Building these resources also brings underlying data questions into focus. Which source is authoritative? What defines the cohort? How should historical program names be handled? Which enrollment date or graduation time frame applies? Those decisions determine whether a trend is interpretable, regardless of how clear the visualization looks.
Accreditation creates a reason to resolve these questions with stakeholders. Documenting definitions and business rules while that work is underway allows the same decisions to support subsequent reporting. A validated dataset can then feed a dashboard, a self-study table, or a customized analysis without requiring the logic to be reconstructed each time.
Practices Other IR Offices Can Use
The design choices in this work suggest several practical starting points:
- Start with recurring requests. Identify measures needed across programs and reviews, then build a common structure around them.
- Build for another year. A five-year reporting requirement should lead to a dataset that can accept year six without reconstruction.
- Make definitions accessible. Keep cohort rules, reporting dates, and calculation methods close to the evidence users will interpret.
- Choose filters deliberately. Anticipate useful follow-up questions and explain when a filter changes only one chart rather than the entire view.
- Assign responsibility for refreshes. Decide who maintains the data and how updates will be checked before the resource becomes part of routine reporting.
- Keep consultation available. Use self-service to reduce repeated retrieval while preserving IR’s role in interpretation.
Keeping the Evidence Useful
Some questions will still require customized analysis. Specialized accreditor definitions, small populations, qualitative evidence, and unusual program structures may not fit a common dashboard. A reusable resource should make room for those cases rather than encourage users to force every question into an existing view.
The broader opportunity comes after the submission. Longitudinal enrollment evidence can inform academic planning; admissions patterns can support recruitment discussions; retention and graduation measures can guide questions about student success. These are uses the same evidence can support, not outcomes that follow automatically from publishing a dashboard.
For an IR office considering this approach, a manageable first step is to select one measure requested repeatedly across self-studies and program reviews. Establish its definition, organize its history, and plan its next refresh. Each recurring request then becomes an opportunity to strengthen a resource the institution can use well beyond the accreditation deadline.
 Osundwa F. Wanjera is Director of Institutional Research, Assessment, and Decision Support at Pratt Institute. His work includes developing evidence resources for accreditation and program review.