Visual Displays of Data

  • Visual Displays of Data
  • 12.20.18

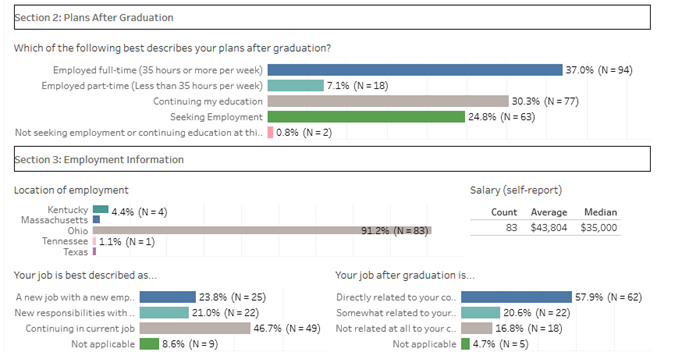
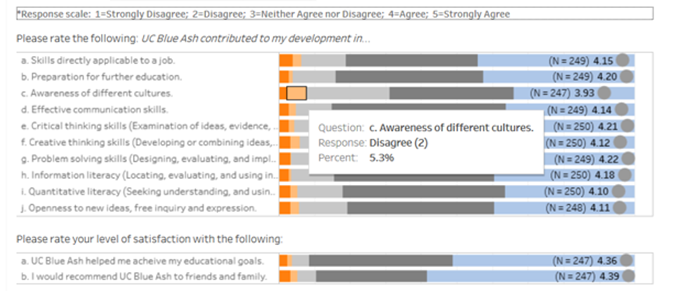
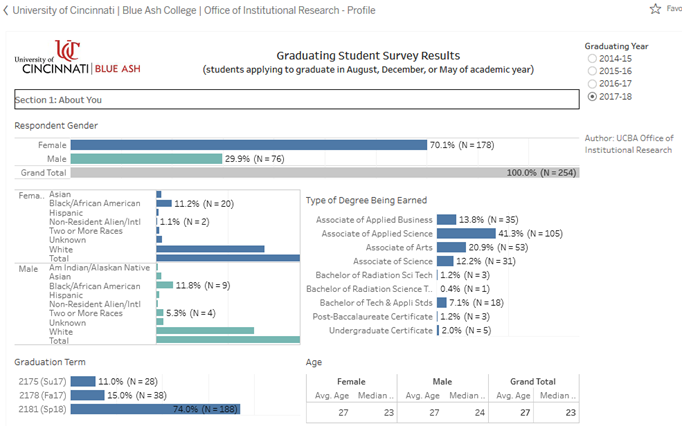
Graduating Student Survey Results Dashboard

  • by Steve Miller, Director/Sr. Analyst, University of Cincinnati Blue Ash College

Sharing results from our Graduating Student Survey typically meant sending or posting Excel or PDF files. Now, we're able to post interactive results in one location, allowing users to view results by year. From an internal site accessible with university credentials, academic chairs and administrators can also filter by academic department and major. These users are also able to view student text responses.

The goal was to provide a concise but viewer friendly summary to help users get familiar with viewing and using results. Additional elements or filters could be added in the future.

The dashboard can be found on our IR web page and on our Tableau Public site.  
vdd1bdec2018vdd2bdec2018vdd3bdec2018

Back to Visual Displays of Data

About eAIR

eAIR is the newsletter of the Association for Institutional Research (AIR). From its start in October 1987 to today, eAIR remains one of the most important tools for providing news to the higher education community.


View Articles By Column

Special Features

Tech Tips

Ask eAIR

IR in the Know

National Survey Data Bite

Board Corner

Announcements

Changing Scene

IPEDS / NCES


Subscribe

Create a free account or update your communication preferences to receive the eAIR newsletter.

Subscribe to eAIR


Contribute

Propose an article to share your perspective or expertise.

Submission Guidelines


Thank You!

2024 - 2025 Editorial Committee