Improving Transparency With Applicant Public Access Portals
The Chilean Ministry of Education, through the Sub-secretariat for Higher Education, has instructed the universities to set up public access portals for applicants as a way to improve transparency in information and the effective communication of information to society to contribute to the final decision of the students when choosing an institution. This is based on one of the principles that inspires the Chilean Higher Education System, as indicated in its article 2, letter j) -transparency-.
Under this concept, these platforms must contain, at least, information related to the following items:
- Undergraduate and postgraduate enrollment
- Alumni
- Academic Staff
- First year retention
- Actual duration and over-duration of academic programs
- Academic Programs
Federico Santa Maria Technical University has made available, through its website, an open data portal aligned with the external mandate. This portal was built in Power BI Desktop and is publicly accessible. (Spanish version)
We present four examples of the displayed data. Where possible, we present the data with a gender-slice approach, so you can see data for both males and females.
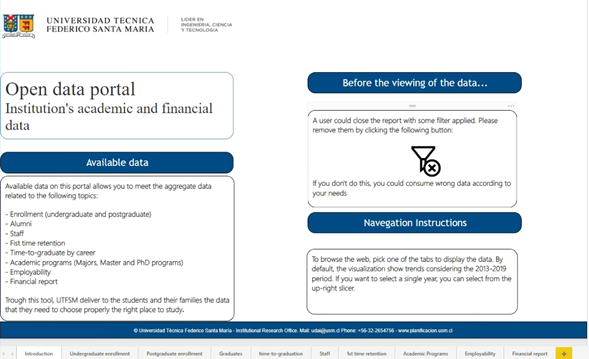
- The first tab is dedicated to explaining the full report. As one of the duties and functions of IR, “serve as stewards of data and information,” this tab seeks the correct support for decision making. It reflects the dates of data wrangling, encourages to the user to click on the “clean filters button,” and presents the relevant topics of the report:

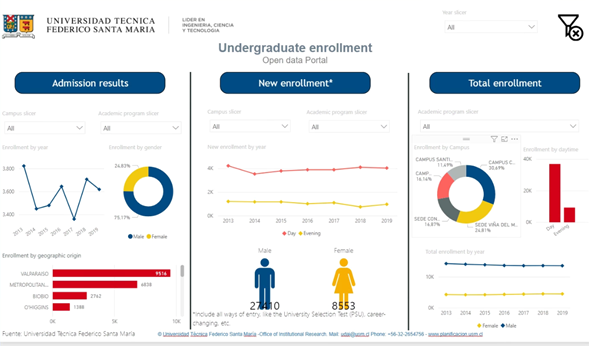
- The second tab shows the trends of the principal admission way (National University Selection Test) and the new and the total enrollment, where the user can slice the data by a set of common filters, as year, campus, or gender.

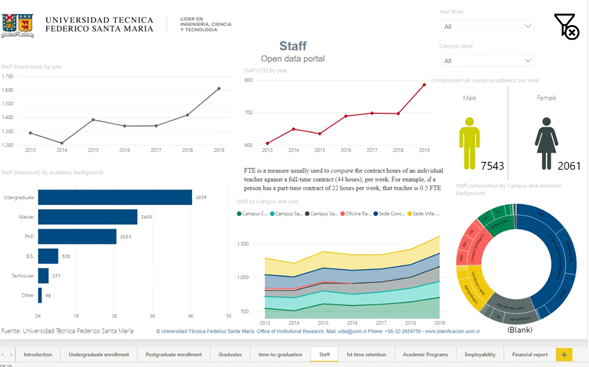
- The third tab shows trends and detailed information regarding academic staff. As many institutions do, USM delivers data in both headcount and FTE (full-time equivalent). One of the roles of an institutional research office is to educate information producers, users, and consumers so we present a brief definition of the FTE meaning. The user can slice the data by year, academic background, campus, or gender with a combination of these variables.

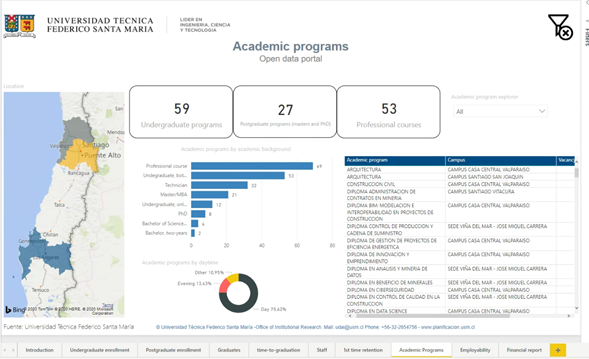
- The fourth tab is related to the academic programs offered by USM:

In this tab, the user can access to the academic programs by location (using Bing maps), the academic background programs, and a detail of the fees related to each program.
