
-
Data Bite August 2017
The Statement of Aspirational Practice for Institutional Research calls for intentional building and support of the institutional research function—the collection of data users and producers across an ins...Read Moreabout: Data Bite August 2017 -
.png?sfvrsn=f63a1b0a_2)
Data Bite June 2017
The National Survey of IR Offices report (page 7) grouped IR offices into three “personalities:” Broad (offices with broad portfolios of work for which they are responsible, 27% of offices), Fo...Read Moreabout: Data Bite June 2017 -
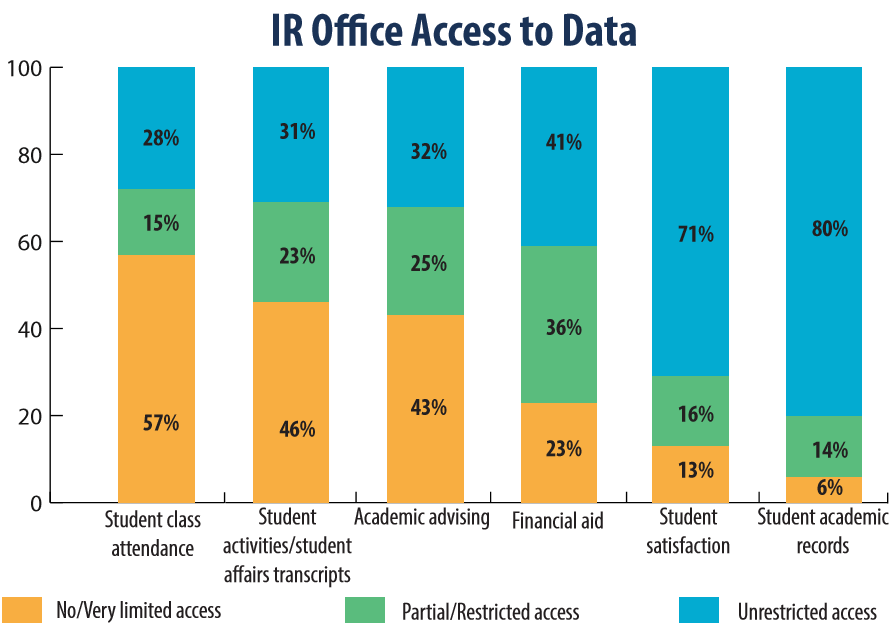
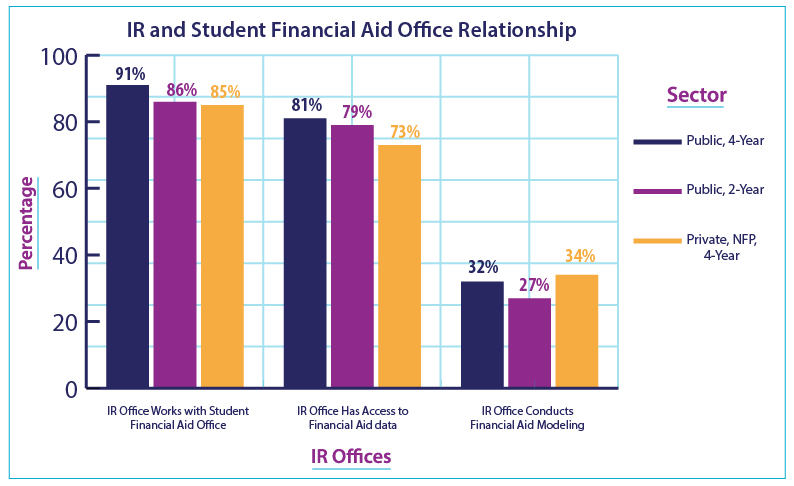
Data Bite May 2017
Access to data is the foundation of a data-informed decision culture. However, some IR Offices report limited or restricted access to a number of institutional data sets that might prove valuable in researching...Read Moreabout: Data Bite May 2017 -
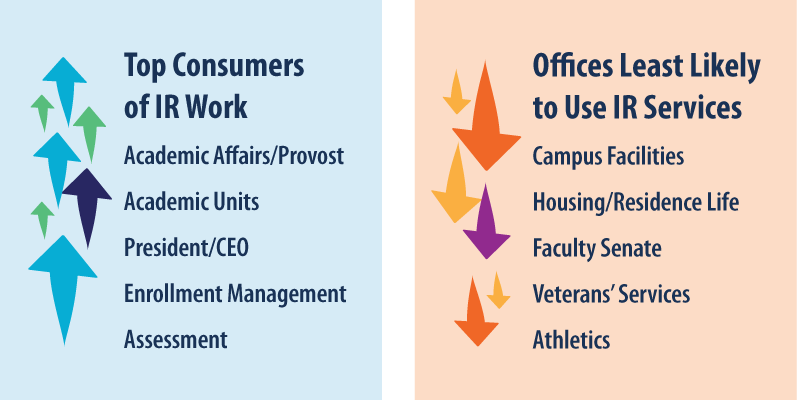
Data Bite April 2017
Institutional research should impact every unit at an institution. But, are some units more likely to use IR than others? According to results from the National Survey of IR Offices, there are certain units more lik...Read Moreabout: Data Bite April 2017 -
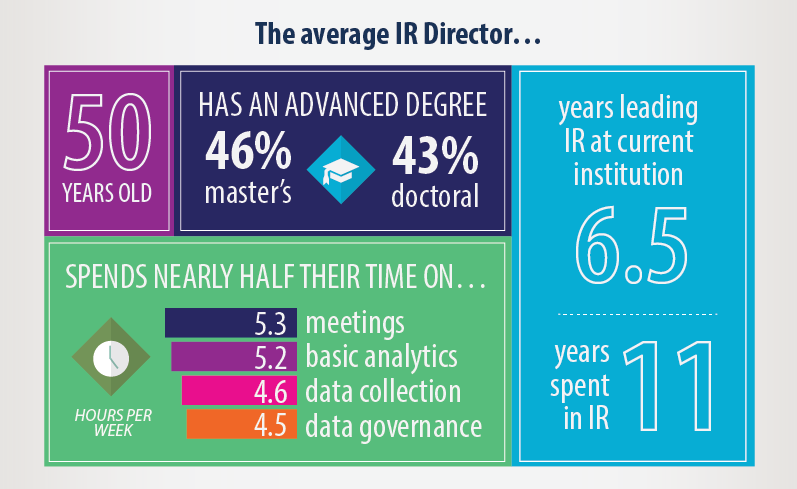
Data Bite March 2017
What does the profile of the average Director of IR look like? Results from the National Survey of IR Offices, in combination with AIR’s membership data, show that the average IR Director is 50 years...Read Moreabout: Data Bite March 2017 -
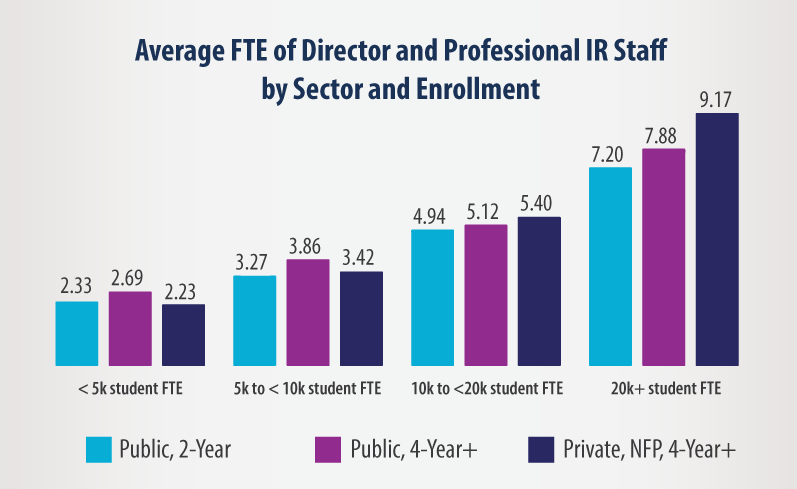
Data Bite February 2017
Last spring, we explored the FTE of the director and professional IR staff and found a correlation between FTE and student enrollment. This month, we go a step further and disaggregate those data by institutional se...Read Moreabout: Data Bite February 2017 -
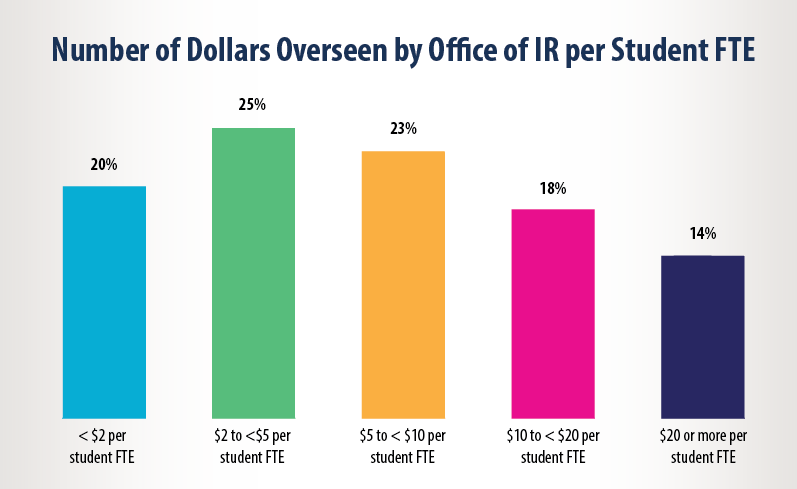
Data Bite November 2016
Last month, we discussed the location of funding for the IR Office. This month, we’ll delve a little deeper into the budget of the IR Office. In the National Survey of IR Offices, we asked respondents for the ...Read Moreabout: Data Bite November 2016 -
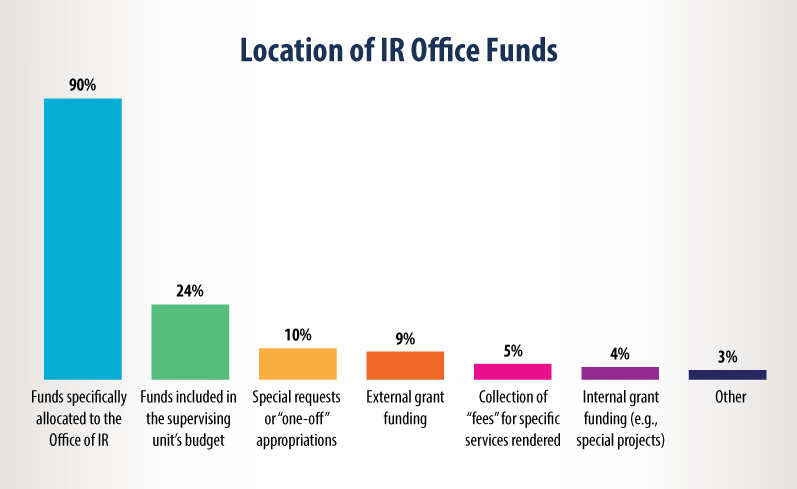
Data Bite October 2016
We’re going to explore the financial resources of the IR Office over the next few Data Bite articles. This month, we’ll look at the location of the financial resources that support the IR Office. ...Read Moreabout: Data Bite October 2016 -
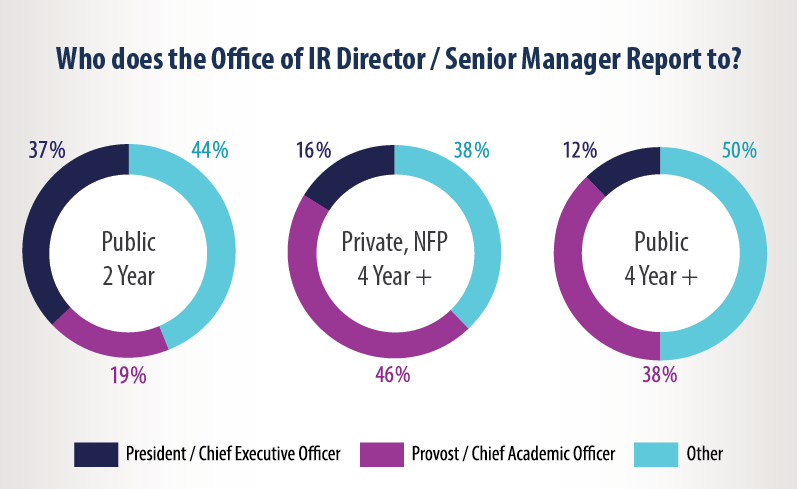
Data Bite September 2016
In last month’s Data Bite, we learned that 51 percent of Offices of IR are located within the division of the Provost/Chief Academic Officer and 26 percent are located within the division of the President/Chief Exe...Read Moreabout: Data Bite September 2016 -
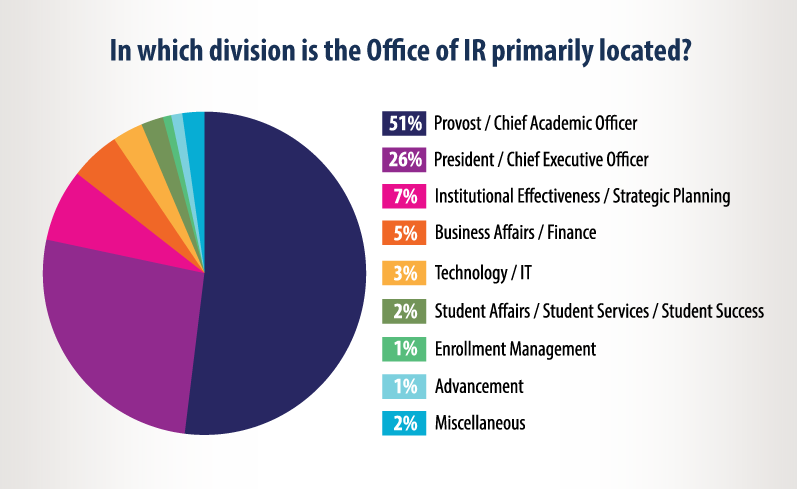
Data Bite August 2016
In which division is your Office of IR primarily located? We find that 77% of public or private, not-for-profit institutions are located within the Provost/Chief Academic Officer division (51%) or in the President/CEO di...Read Moreabout: Data Bite August 2016 -
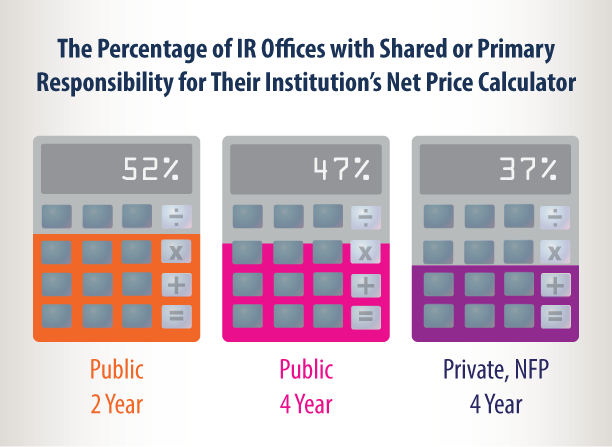
Data Bite July 2016
Net Price Calculators are available on a college’s or university’s website and allow prospective students to enter information about themselves to find out what students similar to them paid to attend the ins...Read Moreabout: Data Bite July 2016 -
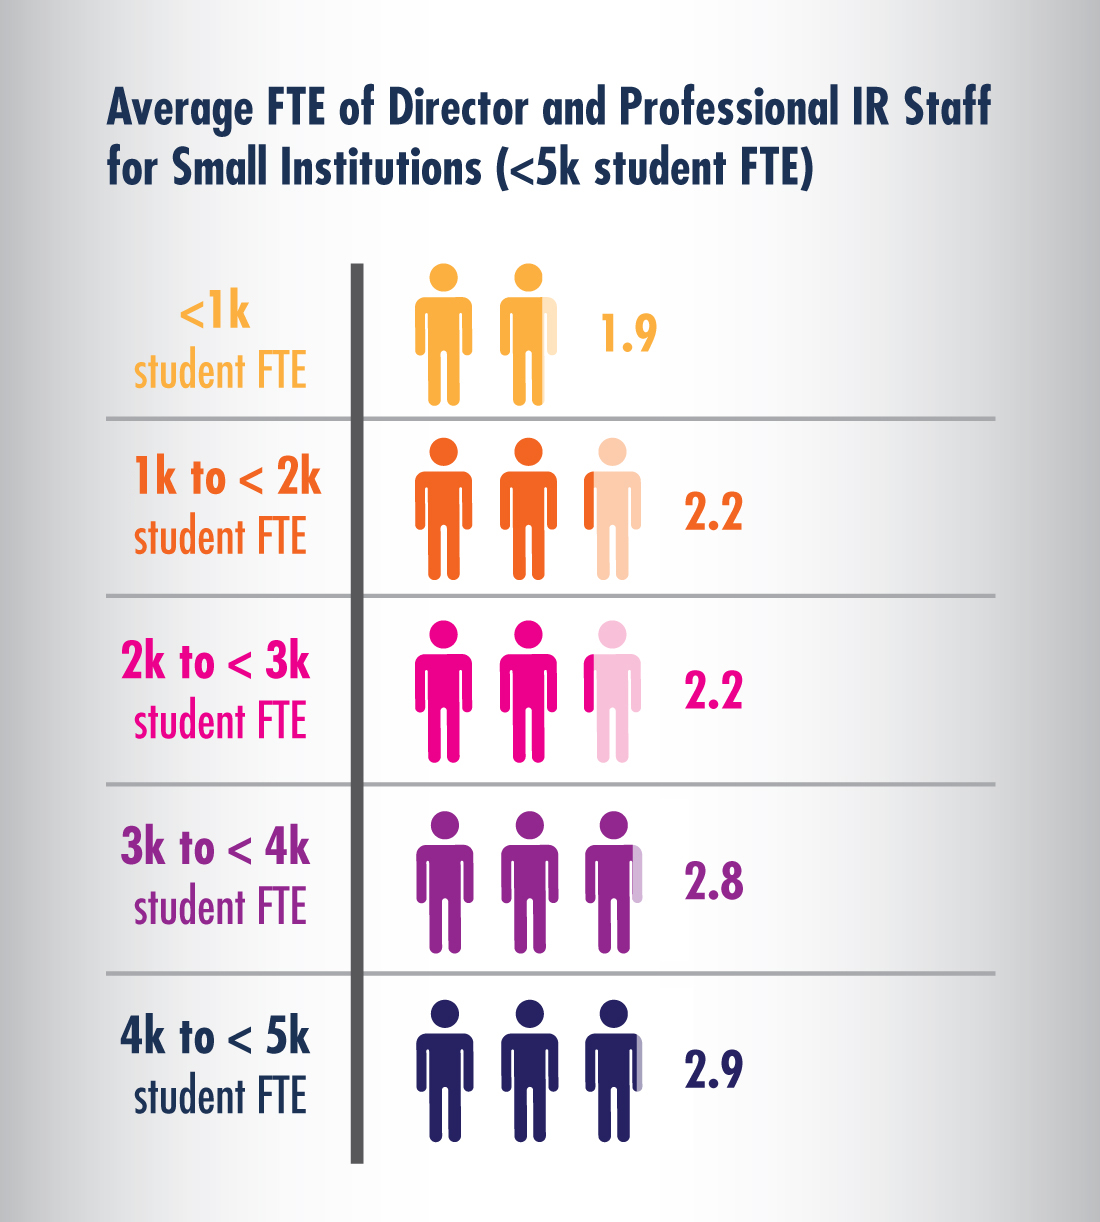
Data Bite June 2016
In the May 2016 Data Bite, we explored the average FTE of the IR Office (Director and Professional IR Staff only) for not-for-profit institutions. Commenters were interested in delving into the staff FTE for small i...Read Moreabout: Data Bite June 2016