Diversity Driving Excellence: A Cross-Departmental Collaboration
In 2018, Virginia Commonwealth University (VCU), a public Research I university with a medical center in Richmond, VA, adopted its current strategic plan, Quest 2025. The plan advanced institutional priorities in four areas: student success, national prominence, collective urban and regional transformation, and diversity driving excellence. The phrase “diversity driving excellence” captures a key insight underlying VCU’s strategic plan, that diversity is and should be a driver of excellence; it is not merely a normative good. Diversity driving excellence is what enables an institution like VCU to be greater than the sum of its individual parts.
The Challenge
A multiplicity of indicators and metrics already existed to measure the first three areas, such as retention and graduation rates, average debt at graduation (student success), levels of grant-funded research, reputational surveys (national prominence), entrepreneurship, and regional economic impact (urban and regional transformation). Priority-setting could be accomplished by selecting metrics that aligned closely with institutional priorities, reviewing recent performance on those metrics, and setting ambitious, realizable goals for the next 6 years.
The strategic priority of diversity driving excellence presented a greater conceptual challenge. VCU, like all IPEDS-reporting institutions, regularly reports data concerning student and faculty diversity. However, those metrics fail to capture the essential meaning of diversity driving excellence, which emphasizes not only diversity, but also inclusion, engagement, and excellence. At VCU, Aashir Nasim, Vice president of Institutional Equity, Effectiveness and Success (IES), developed a more appropriate conceptual model and measurement strategy. Under his leadership, IES partnered with the Office of Institutional Research and Decision Support (IRDS) to develop and implement the Campus Culture and Climate Dashboard, which tracks administrative and academic unit performance toward realizing diversity, inclusion, and engagement goals.
We carried out the creation of the dashboard in four broad steps. These included: development of an appropriate conceptual model; cultivation of partnerships across administrative offices; and empirical validation of the conceptual model. Without these preliminary steps, the fourth step – development of the culture and climate dashboard – could not have succeeded.
Step One: Diversity, Inclusion, and Engagement Model
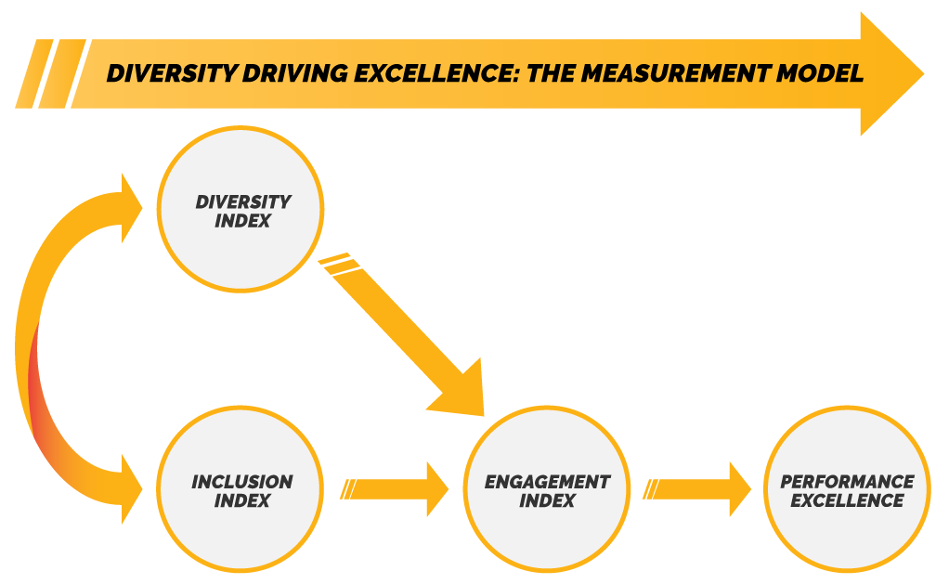
As a first step, Aashir Nasim developed a conceptual model to capture what it means for diversity to drive excellence. In that model, institutional diversity and inclusive culture & practices promote greater engagement. Engagement, in turn, drives performance excellence
To operationalize these concepts, Nasim developed three measures of diversity: compositional diversity, representational equity, and systems diversity. Compositional diversity reflects the extent to which faculty and staff within administrative and academic units reflect VCU’s broader student population. Representational equity reflects the extent to which gender and gender identities are represented in leadership positions within units. Systems diversity is an assessment of the extent to which a unit’s policies, practices, priorities, and procedures reflect VCU’s strategic commitments to diversity and inclusion.
To capture inclusion, VCU developed its campus culture and climate survey based on a framework used in the U.S. Office of Personnel Management (OPM) Federal Viewpoint Survey and an extensive review of existing measures of engagement and inclusion. We surveyed faculty and staff to assess perceptions of the extent to which academic and administrative units are perceived to have a fair, open, empowering, and cooperative environment.
The Engagement Index captures perceptions of leadership integrity within units. The Inclusion Index captures the extent to which unit employees believe they have the trust, respect, and support of their supervisors. Performance Excellence measures global satisfaction and perceptions of unit productivity.
Figure 1: Diversity, Inclusion, and Engagement Model

Step Two: Cultivating Institutional Collaboration
University-level strategic efforts typically are embedded in each unit’s strategic goals. However, strategic efforts that are also personal require considerable pre-work to garner support from the senior leaders of each unit. IES cultivated the needed support from senior leaders at the unit-level through sensitivity conversations prior to launching the survey. As a result, communications from senior leaders promoted a safe-space for faculty and staff to participate in the survey.
The institutional reporting and analysis portion of the project was a collaborative effort between IES and IRDS. An institutional research unit’s access to other key data sources facilitates integration to provide meaningful insights (for example, an in-depth analysis on the effect of the diversity index on faculty retention). Cooperation between IES and IRDS enabled us to understand the downstream positive (or negative) impact of institution- and unit-level culture and climate on key performance metrics.
As a result of this collaboration, it became apparent that continued partnership would be mutually beneficial. In response, we went beyond our initial partnership to institutionalize cooperation between IES and IRDS, which resulted in the creation of a Diversity and Inclusion Data Integration (DIDI) Center, supported by both IES and IRDS. The DIDI Center’s vision is to become the most reliable and trusted source in higher education for diversity and inclusion data analytics to better inform policy and program decisions that enhance diversity and inclusion. The center’s two major goals are to explain the why, what, how and when a problem exists and to visualize and communicate complex narratives into digestible information that is easily accessible.
Step Three: Administering the Survey and Validating the Model
Having (1) established the conceptual model and (2) cultivated institutional partnerships and processes to support VCU’s strategic diversity plan, we administered the climate survey in Spring 2019. We then turned our focus to validating the conceptual model. Our shared research analyst (reporting to IRDS and IES) tested the conceptual model, using data from the campus culture and climate survey.
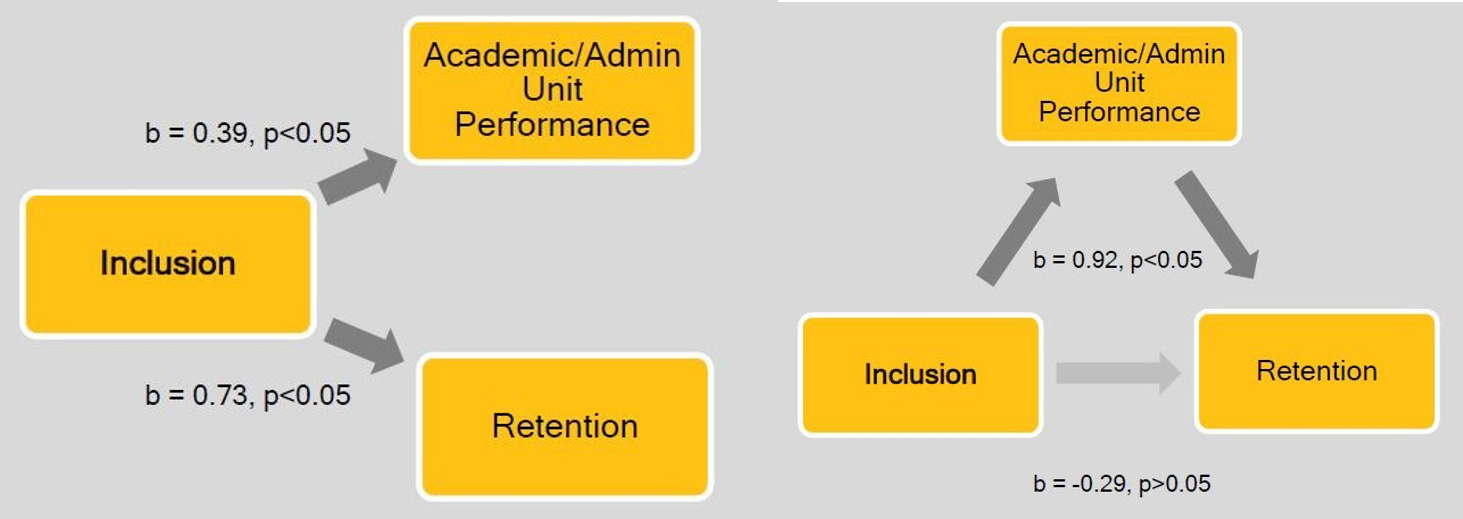
We found that units that scored higher on our inclusion measures also scored higher on perceptions of overall unit performance and that units with higher scores on perceived performance enjoyed superior performance on ‘objective’ criteria of unit performance, such as retention. Moreover, the ultimate positive effect of inclusion on unit retention is mediated by the effect of perceived unit performance.
Figure 2: Inclusion, unit performance, and retention

This example is representative of the overall findings. We found significant support for the proposition that diversity does in fact drive excellence at VCU. This evidence reaffirms our commitment to promote inclusion and engagement as necessary for realizing the potential of diversity.
Step Four: Developing the Dashboard
One benefit of validating the conceptual model is to facilitate institutional buy-in. To catalyze public discussion, we created a public dashboard, summarizing unit performance with respect to diversity, inclusion, and engagement. Since we use multiple measures of each concept, our first task was to construct an index for each. We began by normalizing each measure to a standard, 0-5 scale. We then created weights for sub-indices, corresponding to our understanding of the contribution that each makes to the underlying concept. For our initial iteration of the dashboard, those weights were:
- Diversity
- Compositional diversity - 40%
- Representational equity - 20%
- Systems diversity - 40%
- Inclusion
- Cooperative environment - 25%
- Empowering environment - 25%
- Fair environment - 25%
- Open environment - 25%
- Engagement
- Intrinsic work experience - 33.3%
- Leaders lead - 33.3%
- Supervisor support - 33.3%
We summarized and published this information in a public-facing dashboard. The default summary view presents composite scores, by category, for each unit in the university, and ranks units in order of overall performance (Figure 3). To promote transparency, users can select a detailed view for each unit, which provides a complete breakdown of each composite score and a brief definition of each index component (Figure 4).
Figure 3: Dashboard, summary view

The summary view, shown above, not only helps users to evaluate individual units, but also allows university leaders to identify relationships across different units. This is beneficial for a number of reasons. Notably, it helps us to identify contextual and environmental influences that might not be noticed by focusing on individual units. Perhaps the most common example of this is the discrepancy between academic and administrative units with respect to performance on our diversity index.
At present, the primary limitation of the dashboard is that it is not dynamic; it shows only one snapshot of data, taken in 2019. This is unavoidable, given that a primary source of data for the dashboard is the culture and climate survey which is administered every 18 months. As of the writing of this paper, a second survey administration is slated to be released in Spring 2021. Over time, we will be able to supplement cross-unit comparisons with dynamic, within-unit comparisons.
Figure 4: Unit detail view, [mouse-over on engagement]
![Figure 4: Unit detail view, [mouse-over on engagement] Figure 4: Unit detail view, [mouse-over on engagement]](/images/default-source/news-images/special-features/2021-02-case-study/vcu_casestudy_4.jpg?sfvrsn=cbc57ec5_2)
Conclusions
Within institutions of higher education, conversations surrounding diversity, inclusion, and engagement can easily lead to debate, based on conceptual definitions and individual perspectives. However, there should be little argument concerning the importance of these three concepts; they are central to the way our institution performs its mission, and to achieving our strategic vision. Developing a proven conceptual model, with demonstrable empirical validity, directly promotes VCU’s commitment to its vision of diversity driving excellence.
Embedding diversity into a model for excellence is imperative for higher education leadership; it allows us to embrace diversity and operationalize it into the fabric of academic and administrative working environments. Moreover, the culture that this effort promotes will lead naturally to positive interactions with students, supporting positive student outcomes.
VCU’s success in creating and promoting a diversity driving excellence culture can be attributed, in part, to commitment from university executive leadership. Our experience is that succeeding at university-wide initiatives, in an extremely complex environment, also requires creating a culture of collaboration. That culture of collaboration was integral to the development of VCU’s campus culture and climate dashboard.
Next Steps
Our campus culture and climate dashboard is already driving change within our institution. It informs the development of education and training programs (iExcel). It guides funding decisions (university strategic fund). It promotes core university values of accountability, integrity, and transparency. And it helps to align HR and affirmative action planning with university policies and guidelines.
In the short term, our next steps will be to "refresh" the climate survey and dashboard, in Spring 2021, using the framework that we have created. However, we also look forward to reflecting on our conceptual and (particularly) measurement models. We look forward to discussing our experiences developing VCU’s climate dashboard, and to learning from the experience of colleagues at other institutions.
Aashir Nasim
Vice President of Institutional Equity, Effectiveness, and Success
Virginia Commonwealth University
anasim@vcu.edu
Monal Patel
Associate Vice Provost for Institutional Research and Decision Support
Virginia Commonwealth University
mpatel22@vcu.edu
Christopher Marcoux
Director of Analytics, Office of Institutional Research and Decision Support
Virginia Commonwealth University
marcouxc@vcu.edu
