Geography and Higher Education
While universities have experienced increased diversity in access over time, there continues to be a large disparity in educational attainment among students of different socioeconomic statuses, parental education levels, and racial and ethnic backgrounds (Cahalan, Addison et al. 2022, Seymour and Hunter 2019). To address such equity issues, many universities allocate significant resources and funding to programs and initiatives that support the success of diverse and low-income students. Institutional Research (IR) offices support these programs by providing data, reports, and analytics based on student socio-demographic variables collected in our data systems (e.g., ethnicity/race, sex, and first-generation status). Additionally, financial aid data can provide further context, but regulations prohibit the use of such data for certain projects that are not tied to financial aid decision-making (Privacy Technical Assistance Center 2017).
Work by Chetty and colleagues (Chetty et al. 2018) has shown how outcomes in adulthood are greatly influenced by opportunities experienced in childhood (e.g. see Chetty et al. 2018)—opportunities that characterized geographic localities. Experiences in childhood carry over to the higher education context, where they impact and mediate belonging and outcomes for a student’s career. Despite efforts invested in programs supporting minoritized students, institutions of higher education might still not provide educational environments where all students can thrive. There is also evidence of a persistent rural/urban divide in access and outcomes experienced by prospective and enrolled students (unpublished data from our institution).
In this contribution, we illustrate an approach for integrating institutional data with other geographic- specific data to expand the ability to evaluate factors affecting student outcomes and to inform programs in support of a diverse student body. This can potentially enhance the reach an institution of higher education can have in local communities, and its mission to provide all students with rich educational experiences for academic and career success.
Geocoding Student Data
The use of geographic-related data is already a common practice in IR. For example, IR offices often report enrollment by state and county, or by high school of origin. ZIP codes, as a geographic unit, are also used to increase the granularity of the geographic attribute. Admission offices can also opt to purchase geographic data from the College Board, which offers high school and neighborhood information as clusters of shared attributes (see College Board 2024). However, except for the College Board data, the geographic detail is at a rather coarse scale and does not allow integration of other U.S. Census Bureau data, or other data available at a more granular geographic level.
How does the U.S Census Bureau organize geographic entities? The standard hierarchy of Census geographic entities illustrates the relationships between various legal, administrative, and statistical boundaries as defined by the U.S. Census Bureau. This hierarchical framework clarifies how different geographic entities are interconnected or separate (see Figure 1). This breaks the landscape into interconnected parts and allows for associating portions of a landscape to geographic identifiers called GEOIDs. A GEOID (Geographic Identifier, see Figure 2) in the U.S. Census is a unique code that identifies various geographic areas such as states, counties, tracts, and blocks. It allows for precise linking of Census data to specific locations. The GEOID structure reflects the hierarchical nature of these areas, ensuring that each unit can be uniquely identified. For example, the GEOID for a Census block, which is the smallest geographic unit, combines the codes for the state, county, tract, and blocks.
Figure 1: U.S. Census Geographic Entities Hierarchy.
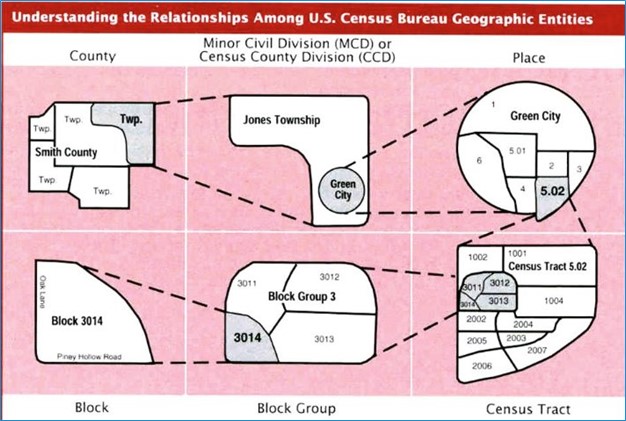
Source: University of Pittsburgh, Understanding Census Geography.
Figure 2: U.S. Census Geoid illustration.
| 181270504073013 GEOID | 18 | 127 | 050407 | 3013 |
| State code | County code | Census Tract | Census Block |
Source: US Census, Understanding Geographic Identifiers (GEOIDs).
To obtain the narrowest geographic entity of a student, we applied a geocoding process, which involves converting addresses into geographic coordinates. The U.S. Census Bureau's geocoding tool not only provides these coordinates but also appends Census geographies like state, county, Census tract, and block. Python and R packages are available for automating the geocoding operation (Figure 3).
The first step involves data collection, preparation, and handling of student addresses and populations. We pull these data from our sources and clean them to be used with U.S. Census tools. The second step matches our population data with U.S. Census data by sending address batches to the Census geocoder and managing tied addresses. The third step involves obtaining demographic, economic, and population data using U.S. Census tools and APIs. Users can access data through the data.census.gov website, applying geographic filters for specific tables, or retrieving data programmatically via the U.S. Census API using Python or R by specifying variables and geographic entities.
Figure 3: Geocoding and API process.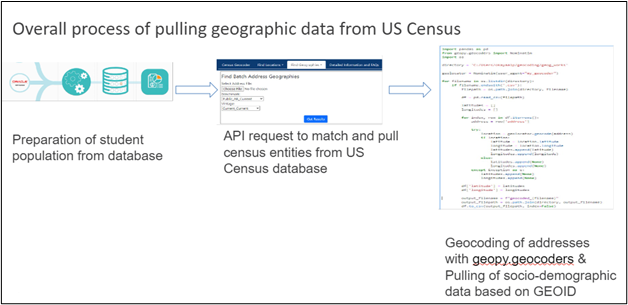
Source: The figure is compiled by the authors.
Exploring Access and Reach Using Census Tract Level Data
Having the Census tract granularity already affords insights on micro-areas that are more likely to send students to your institution, as well as reach that an institution has within a geographic region, a city, or the state. Specifically, this analysis can be conducted by comparing the presence of students in a cohort that come from a Census tract relative to the share of the resident population of college-age, eligible residents of that Census tract. The population of reference can be customized to reflect the demographic served by the institution.
The comparison can be represented as coverage, e.g., the percentage of Census tract that has at least one student in the cohorts, or as a representation ratio:
A representation ratio greater than 0 indicates tracts with more representation than expected and below 0 indicates lower representation than expected. This metric reveals the extent to which an institution is drawing more or fewer students than would be expected given the tract’s characteristics. The plot in Figure 4 reflects the distribution of Census tract representation for a set of three arbitrary campuses. For campuses X and Y, one can see that these campuses pull from a wide range of Census tracts (>90% of Census tracts) both on the high and low ends of representation (roughly a symmetric distribution), but with the typical Census tract having slightly lower than expected representation (center of distribution less than 0). For campus Z, the typical Census tract is either highly represented or has basically no representation (two peaks in the distribution – one > 0 and another < 0); this pattern may be common among campuses with a targeted community or regional presence.
Figure 4: Distribution of Census tracts by log(Representation Ratio) and Arbitrary Campus.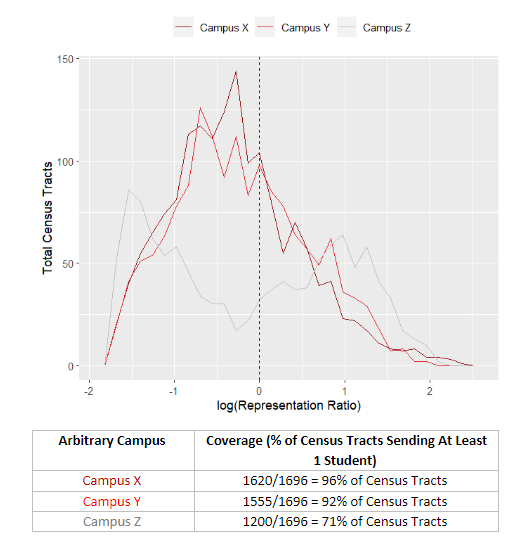
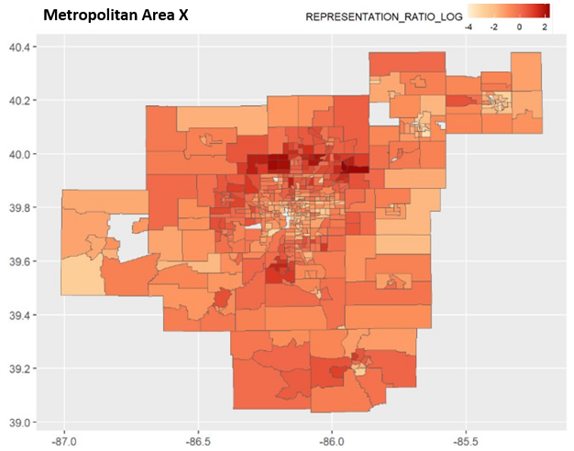
Figure 5 shows the representation ratios for tracts in a metropolitan area, identifying areas at higher representation, as well as areas that could be candidates for targeted outreach or program development, to ease the transition from high school to higher education.
Figure 5: Census Tract Representation for an Arbitrary Metropolitan Area and Campus.
Integrating Geographically Specific Data Sources
The original drive for integrating geographically-specific data sources aimed at extending the work of Marco Molinaro, at the University of Maryland (formerly at U.C. Davis), to the SEISMIC Collaboration (Sloan Equity and Inclusion in Introductory STEM Courses – seismicproject.org). In his work, Molinaro showed a relationship between student outcomes in courses and the Regional Opportunity Index (a metric developed and maintained by the Center for Regional Change at U.C. Davis) for a student. We have found similar patterns at our institution using data from the sources listed below.
Nationally, there are various data sets that provide insights on opportunity distributions. In our work, we have found valuable data available in three data sources: the U.S. Census Opportunity Atlas (U.S. Census Bureau 2022, Chetty et al. 2018); the time-dependent census tract attributes available through the National Institutes of Health Surveillance, Epidemiology, and End Results Program (National Cancer Institute 2022); and the Centers for Disease Control/Agency for Toxic Substances and Disease Registry Social Vulnerability (Centers for Disease Control and Agency for Toxic Substance and Disease Registry 2022). These data sources and the geographically explicit approach they apply, support institutional goals of providing opportunity to diverse sets of students, and more broadly, contribute to a richer understanding of the student experience, once a student is on our campuses, within the myriads of analyses that rely on indicators of student background.
U.S. Census also provides sources that differentiate urban areas from rural areas. Institutional researchers can integrate typical Census or household survey data and construct relevant clusters and analyses to address specific programs or meet the information needs of campus leadership.
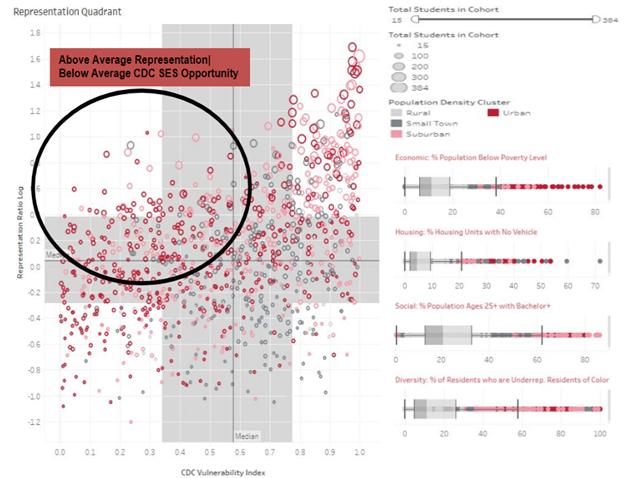
Figure 6 provides an example of integration of the representation ratio and opportunity data at the Census tract level. This plot identifies tracts at low opportunity and higher representation (top left quadrant). This knowledge can be used to investigate and learn from those areas to support programs in areas that fall in the bottom left quadrant, namely areas at low opportunities and low representation ratio.
Figure 6: Quadrant of Census tract Representation (vertical axis) vs. CSC Socioeconomic Opportunity (horizontal axis), with selected Census tract statistics.
Conclusions
There is a continuum connecting an institution and the communities it serves. Integrating institutional research datasets with geographically explicit information opens opportunities for discovering patterns relevant to the education and service mission of higher education institutions. This knowledge can be used to build community partnerships, enhancing the institution’s ability to increase access for underserved areas. It can improve recruiting strategies and strengthen K-12 to higher education pipelines. Finally, it can inform on-campus belonging programs, initiatives, and academic support, such as enhancing training on the hidden curriculum (Gonin et al. 2023), to ensure that students from any background can thrive on their educational paths.
Citations
Alliance for Higher Education and Democracy of the University of Pennsylvania (PennAHEAD).
Bottia, M. C., Mickelson, R. A., Jamil, C., Moniz, K., and Barry, L. (2021). Factors associated with college STEM participation of racially minoritized students: a synthesis of research. Rev. Educ. Res. 91, 614–648. doi: 10.3102/00346543211012751.
Cahalan, M. W., et al. (2022). Indicators of Higher Education Equity in the United States: 2022 Historical Trend Report. Washington, DC, The Pell Institute for the Study of Opportunity in Higher Education.
Centers for Disease Control and Agency for Toxic Substances and Disease Registry (2022). "CDC/ATSDR Social Vulnerability Index." Retrieved October 20, 2022.
Chetty, R., Hendren, N., Jones, M. R., and Porter, S. R. (2020). Race and economic opportunity in the United States: an intergenerational perspective*. Q. J. Econ. 135, 711–783. doi: 10.1093/qje/qjz042.
College Board (2024). Landscape. Landscape – Higher Ed | College Board, retrieved May 20, 2024.
Council for Opportunity in Education (COE).
Gonin, M., Truglia, M.H., Pedzinski, S., Sidky, S. (2023). Unspoken Expectations and Student Success: Revealing the Hidden Curriculum. Center for Innovative Teaching & Learning, Indiana University Bloomington. https://blogs.iu.edu/citl/2023/01/11/hidden-curriculum/ Retrieved June 10, 2024.
National Cancer Institute (2022). "Surveillance, Epidemiology, and End Results Program: County/Tract Attributes." Retrieved October 20, 2022.
Privacy Technical Assistance Center (2017). Guidance on the Use of Financial Aid Information for Program Evaluation and Research. Washington, D.C., US Department of Education.
Seymour, E., and Hunter, A.-B. (Eds). (2019). Talking about leaving revisited: Persistence, relocation, and loss in undergraduate STEM education. Cham: Springer International Publishing.
Stich, A. E. (2021). Beneath the white noise of postsecondary sorting: a case study of the “low” track in higher education. J. High. Educ. 92, 546–569. doi: 10.1080/00221546.2020.1824481
University of Pittsburgh. (n.d.). Understanding Geography: U.S. Census. Retrieved from https://pitt.libguides.com/uscensus/understandinggeography.
U.S. Census Bureau. (n.d.). Geographic Identifiers. Retrieved from https://www.census.gov/programs-surveys/geography/guidance/geo-identifiers.html.
US Census Bureau, et al. (2022). "Opportunity Atlas Data Tool." Retrieved October 20, 2022.
 Stefano Fiorini Ph.D. Ph.D. is a Social and Cultural Anthropologist with the Research and Analytics team, a subunit within Indiana University’s Institutional Analytics office. He has extensive applied research experience in the areas
of institutional research and learning analytics. He has published in peer reviewed journals and conference proceedings and presented at national and international conferences (e.g. AIR Annual Forum, CSRDE, LAK), earning best paper awards from INAIR,
AIR and SoLAR.
 Gina Deom has nearly 10 years of experience working in higher education data and research. She currently serves as a data scientist with the Research and Analytics team, a subunit within Indiana University’s Institutional Analytics
office. Gina has given several presentations at national and international conferences, including the SHEEO Higher Education Policy Conference, the NCES STATS-DC Data Conference, the Learning Analytics and Knowledge (LAK) Conference, and the AIR Forum.
Gina has earned a best paper award from INAIR, AIR, and LAK.
 Özgür Kayaalp, Ph.D. works as a data analyst on the Research and Analytics team at Indiana University. His role involves performing data analysis, predictive modeling, machine learning, and supporting data visualization for
the team. Before joining this role, he worked for the University of Central Florida, NATO, and the Turkish Navy. Besides his methodological focus areas, which include data scientific models and learning analytics, he is also interested in international
relations and environmental politics. He has published several articles and datasets in Politics & Policy, Harvard Dataverse, and Florida Political Chronicle.
