Analyzing Academic Program Fiscal Performance
Understanding the financial viability of academic programs is increasingly at the forefront of discussions at small colleges and universities. However, a simple analysis of direct gross profits can be misleading if not properly benchmarked against costs. For example, programs with low absolute profits are not necessarily fiscally struggling programs, especially if investments or costs are, likewise, low. Also, number of majors are further not powerfully linked to program fiscal health, as such numbers fail to account for general education and support course services offered by many smaller programs. A better understanding of program fiscal health can be achieved if profit margins, through tuition and fees, are calculated relative to direct program investments. In essence, such an approach represents an adjusted return on investment for academic programs compared to a non-adjusted examination of profit or loss.
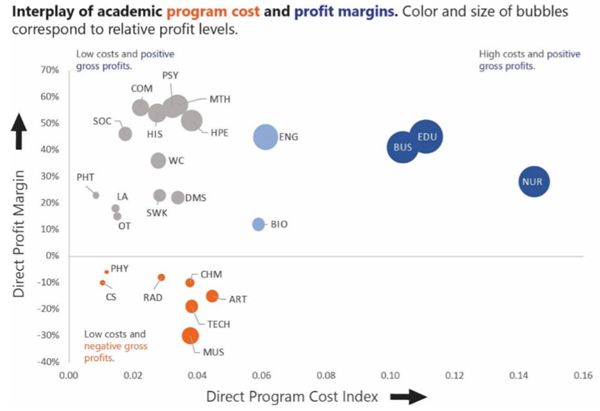
Below is an example static visualization designed for distribution among faculty, administrators, and executives to permit a more holistic understanding of an academic program’s return on investment. The aim is to concurrently compare an academic unit’s financial efficiency (relative profit margin) against a normalized investment index (proportion of total direct investment). The result is that smaller programs with higher profit margins are accordingly recognized. Based on absolute profit values, smaller programs (such those in the gray bubbles) would have been judged as less contributive.
However, when adjusted for relative investment, many of these smaller programs outperform the larger programs in business, education, and nursing. Such an approach is necessary to properly assess program efficiency and accurately estimate financial performance for making comprehensive data-informed decisions.

For more details on cost and profit calculations please contact me.
