Qlik Sense: Visualizing Future Enrollment/Tuition Revenue
This visual display focuses on predicting enrollment of admitted applicants depending on the amount of a scholarship offer. Predictions are visualized using the dashboard with a possibility to explore "what if" scenarios that help admissions professionals to leverage scholarship offers. The dashboard offers predicted enrollment and tuition revenue.
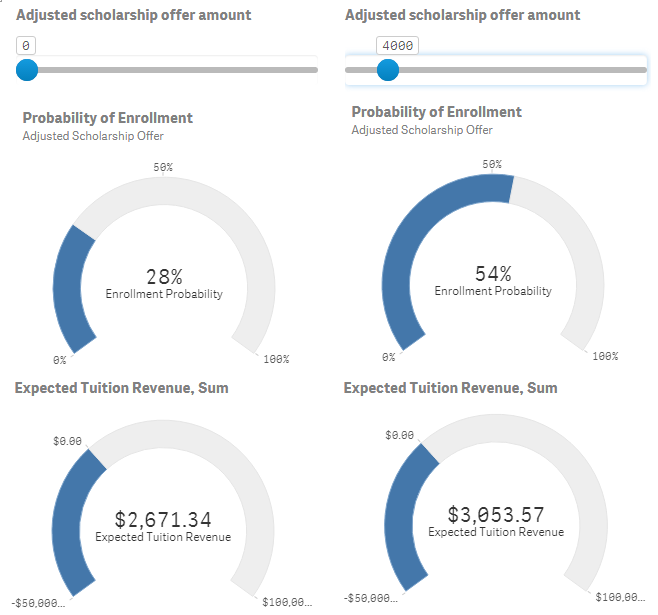
To explore how the probability of enrollment would change depending on the scholarship offer, a user can manipulate the amount of scholarship offer. Multiplying tuition minus scholarship amount by the probability of enrollment provides an expected tuition revenue. For example, for a selected admitted applicant, the probability of enrollment increased from 28% to 54% once the scholarship amount changed from $0.00 to $4,000. Even though tuition for this admitted applicant becomes $4,000 less, the expected tuition revenue goes from $2,671.34 to $3,053.57 due to a substantial increase in the probability of enrollment.

Aside from selecting an individual admitted applicant, admission counselors can select a group of applicants by gender; by ethnicity; by residency; by high school GPA; by ACT or SAT equivalent; by college of interest; by financial aid eligibility—e.g., applicants, who did not file FAFSA, applicants who filed FAFSA and are ineligible for Pell grants, and Pell eligible applicants.
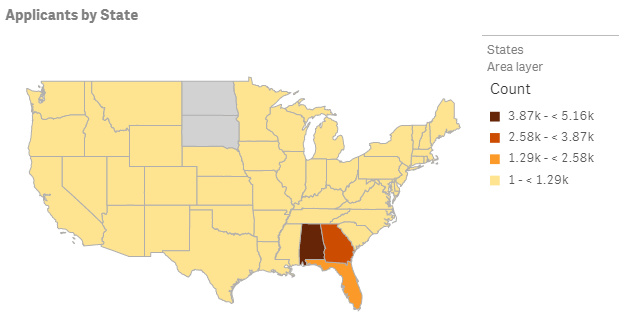
Some of the visualizations for this tool include the information and a possibility of selecting applicants by state or by county for in-state residents.

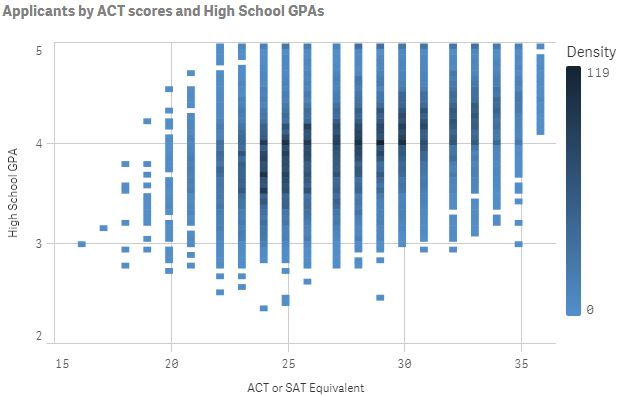
Visualizing ACT or SAT equivalent scores and high school GPAs of admitted applicants and of projected students helps quickly assess prior academic performance of incoming freshmen.

Incorporating a possibility to manipulate a scholarship offer is implemented using Qlik extension qsVariable. Behind the tool, there are 12 models that predict the probability of enrollment of admitted applicants. Separate models are built for enrollment in fall and in spring, for enrollment of in-state and of out-of-state students, and for enrollment of applicants by financial aid eligibility.
