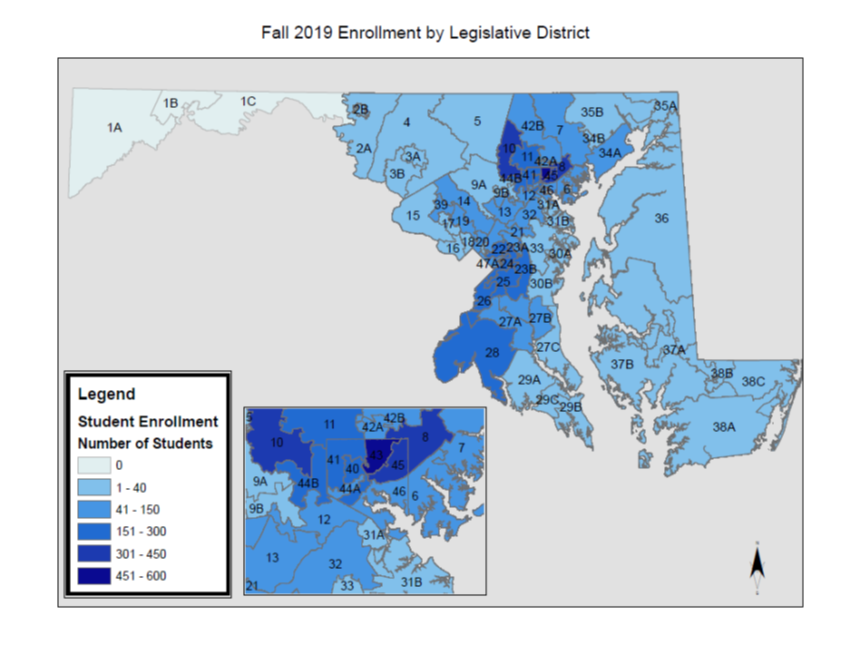
Mapping Economic Impact
Morgan State University commissioned an economic impact study in 2018. The publication of this study and the desire of the Office of Institutional Research to contribute data points to demonstrate the impact of our stakeholders served as the impetus for a collaborative GIS project with the Morgan State University Department of Economics. Maps were created using Arc GIS Pro and Arc Map. As a public institution we thought mapping our stakeholder by legislative district would be of interest to the university community as well as our government officials. We mapped fall 2018 enrollment, alumni, and employees by legislative district. We also updated the enrollment map to reflect fall 2019 enrollment and will be updating the alumni and employee maps. Campus consensus was that these maps would be useful in encouraging stakeholders to register and turn out to vote as well as demonstrating to state legislators the reach of our institution.

