Released May 2023
An institution’s campus climate survey is a powerful tool to better understand the perceptions and experiences of students, faculty, and staff, identify strengths and areas for improvement, and measure progress on key initiatives. The Association for Institutional Research (AIR) was interested in better understanding campus climate surveys and the role of IR/IE in those studies, so we conducted a survey of 300 randomly selected members at US higher education institutions. The survey launched March 9, 2023, and closed on March 23, 2023; the response rate was 21%.
When asked about the roles that the IR/IE office play regarding institutional campus climate studies, 56% of survey respondents reported that their office participated in data collection, 53% were involved in data reporting, and 48% were involved in data analysis (see Table 1).
| Role | % of Respondents |
|---|---|
| The IR/IE office analyzed the data. | 56% |
| The IR/IE office reported the data. | 53% |
| The IR/IE office collected the data. | 48% |
| The IR/IE office participated in identifying improvement actions. | 41% |
| The IR/IE office drafted the survey/data collection instrument. | 31% |
| The IR/IE office is not involved in campus climate studies. | 25% |
| The IR/IE office participated in implementing improvement actions. | 13% |
| Don’t know | 8% |
| The institution does not conduct campus climate studies. | 3% |
NOTE: This question allowed for multiple responses; column will not add to 100%.
Survey respondents were also asked when the campus climate survey was last conducted by the IR/IE office; we found that over half had conducted this survey within the past year (see Table 2).
| Year | % of Respondents |
|---|---|
| 2022 | 59% |
| 2021 | 22% |
| 2020 | 6% |
| 2019 or earlier | 9% |
| Don't know | 4% |
We asked the frequency of campus climate surveys being conducted by the IR/IE office and found that most conduct this survey at least every three years (see Table 3).
| Frequency | % of Respondents |
|---|---|
| Every year | 30% |
| Every 2 years | 12% |
| Every 3 years | 18% |
| Every 5 years | 3% |
| Other schedule | 9% |
| As needed, no set schedule | 28% |
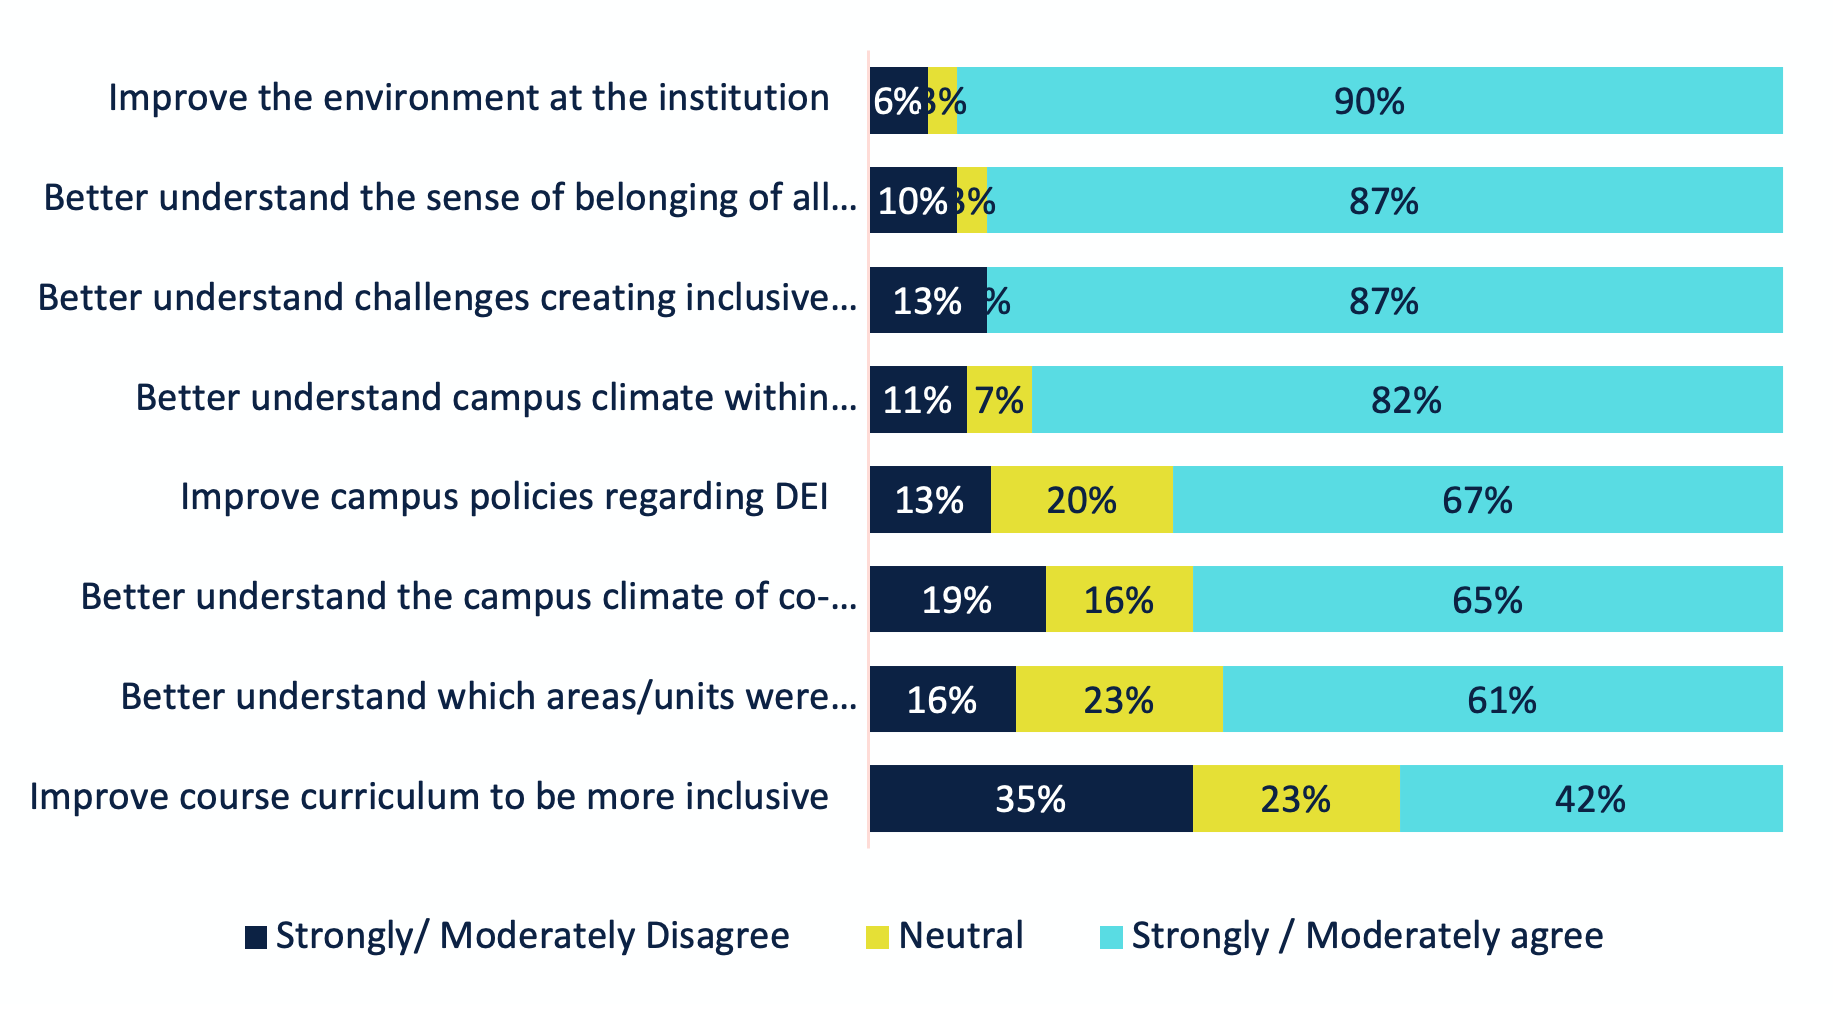
We asked respondents to indicate how the results of the latest campus climate survey were used. 90% of respondents said results were used to improve the environment of the institution and 87% reported it helped their institution to better understand students’ sense of belonging and the challenges facing their institution in creating inclusive environments (See chart 1).
Chart 1. Level of Agreement on Institutional Campus Climate Surveys

When asked how campus climate survey results were used to improve the student experience, the major themes were identification of strengths and weakness for improvement, monitoring of key performance indicators (KPIs) which helps in decision making, and making informed action plans.
Survey respondents who indicated that their IR/IE office were not involved in campus climate studies, indicated that those studies were typically led by diversity and inclusion units, faculty committees, or the President’s office.
About
AIR conducts surveys community surveys on a variety of topics to gather in-the-moment understanding from data professionals working in higher education.
Image Description
Chart 1.
Chart 1 is a bar chart showing level of agreement at responding institutions.
| Chart 1. Level of Agreement on Institutional Campus Climate Surveys | Strongly/ Moderately Disagree | Neutral | Strongly / Moderately agree |
|---|---|---|---|
| Improve course curriculum to be more inclusive | 35% | 23% | 42% |
| Better understand which areas/units were more/less accepting | 16% | 23% | 61% |
| Better understand the campus climate of co-curricular activities | 19% | 16% | 65% |
| Improve campus policies regarding DEI | 13% | 20% | 67% |
| Better understand campus climate within classrooms | 11% | 7% | 82% |
| Better understand challenges creating inclusive environments | 13% | 0% | 87% |
| Better understand the sense of belonging of all students | 10% | 3% | 87% |
| Improve the environment at the institution | 6% | 3% | 90% |
Return to content
