
Released July 2023
The Association for Institutional Research (AIR) conducted a survey of 300 randomly selected members from U.S. post-secondary institutions to explore Institutional Research (IR)/Institutional Effectiveness (IE) office capacity. The survey launched March 24, 2023, and closed on April 7, 2023; the response rate was 24%. All questions were measured on 5-point Likert scales.
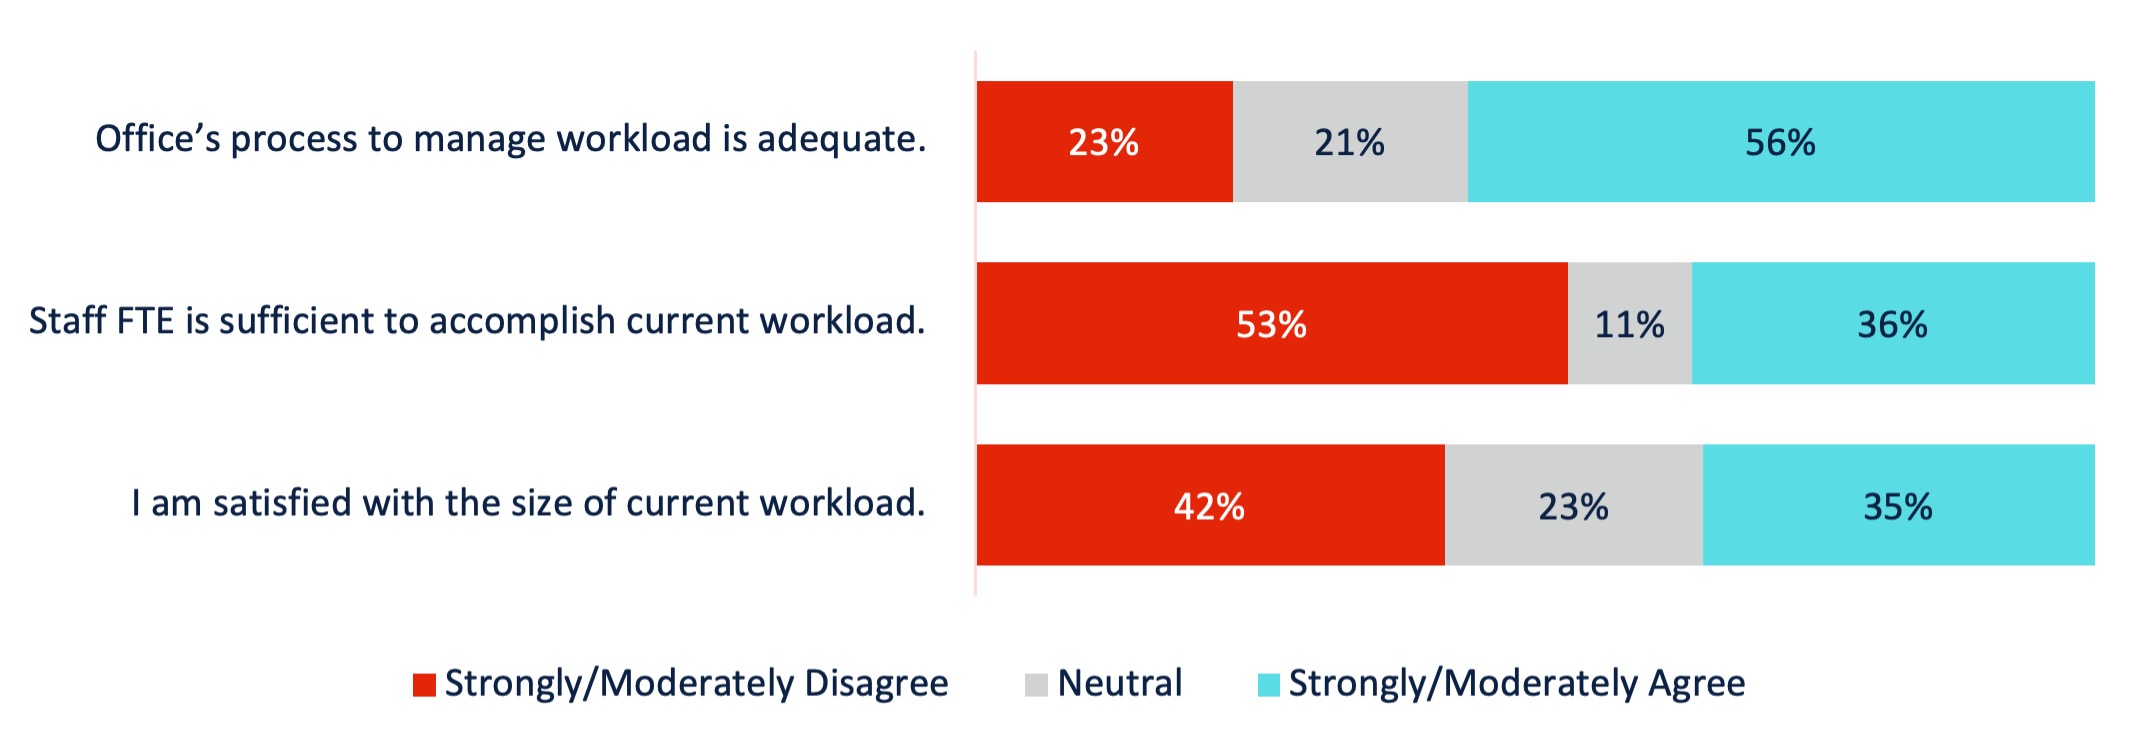
We asked survey respondents to evaluate their IR/IE office workloads (measured on a 5-point Likert scale). Just over half of respondents (56%) agree that their offices’ processes to manage workloads are adequate (Chart 1). However, about half report (53%) that staff sizes (full-time equivalent or FTE) are not sufficient to accomplish current workloads, and 42% indicated that they are dissatisfied with the sizes of their current workloads.
Chart 1. IR/IE Office Workload
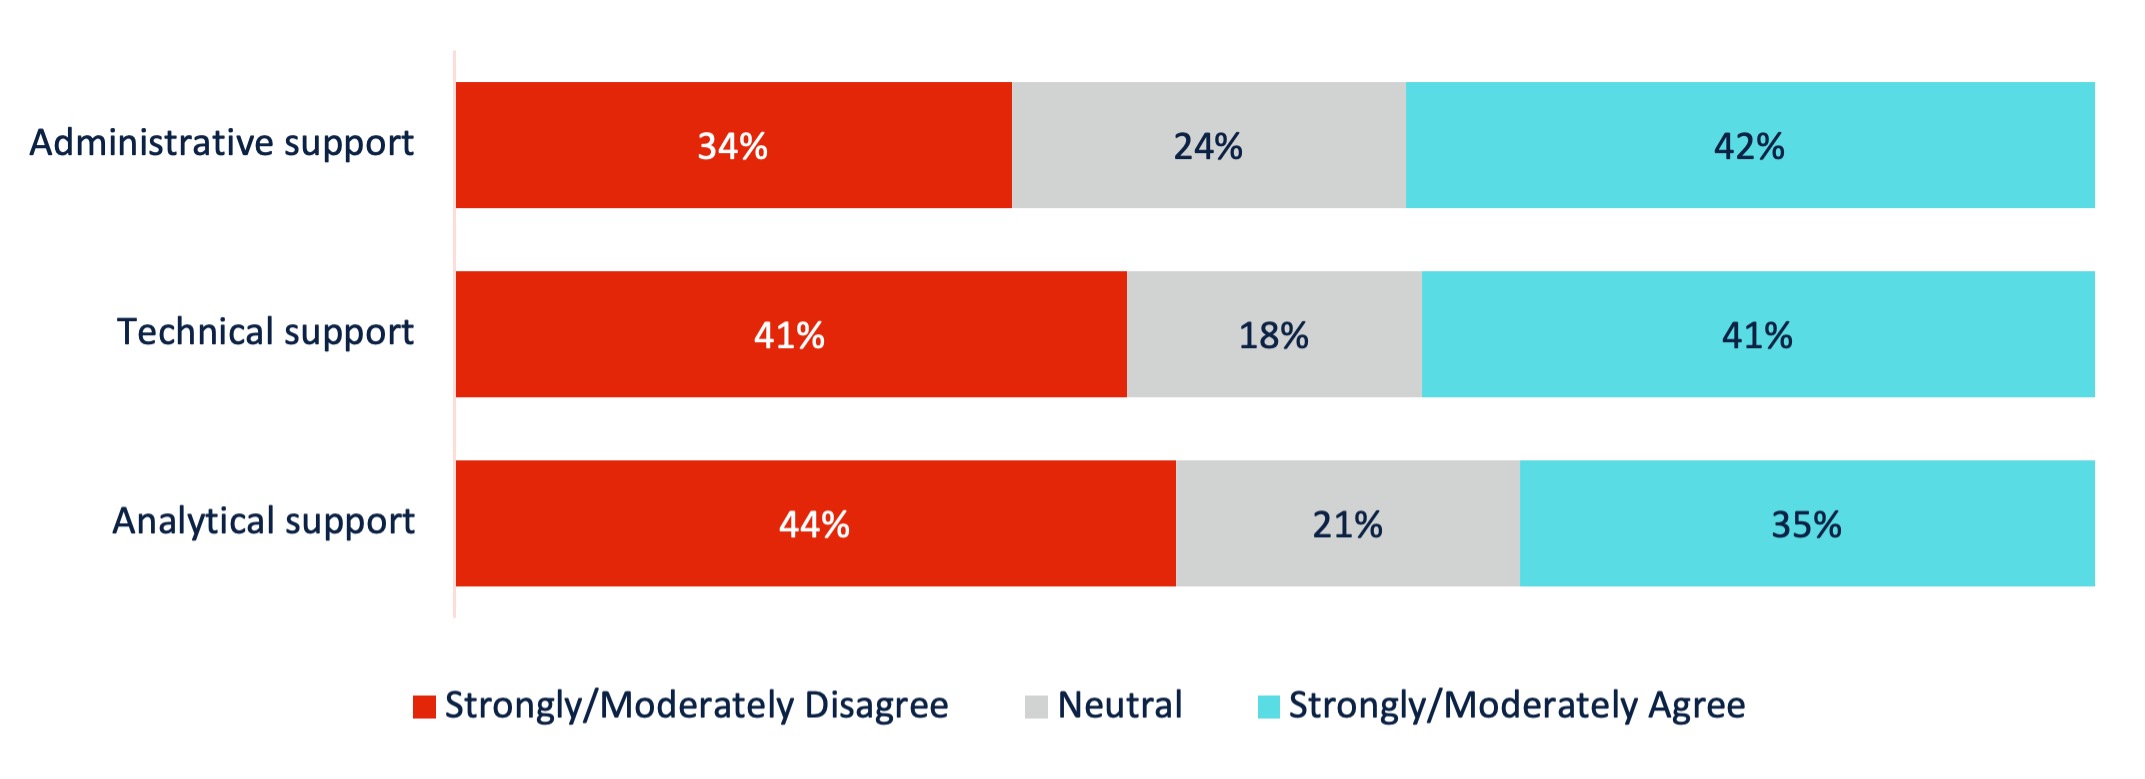
Next, we asked survey respondents to indicate whether they have sufficient support to accomplish their current workloads (measured on a 5-point Likert scale). More respondents report that they have sufficient administrative and technical support than analytical support (Chart 2).
Chart 2. IR/IE Office Has Sufficient Support to Accomplish Current Workload
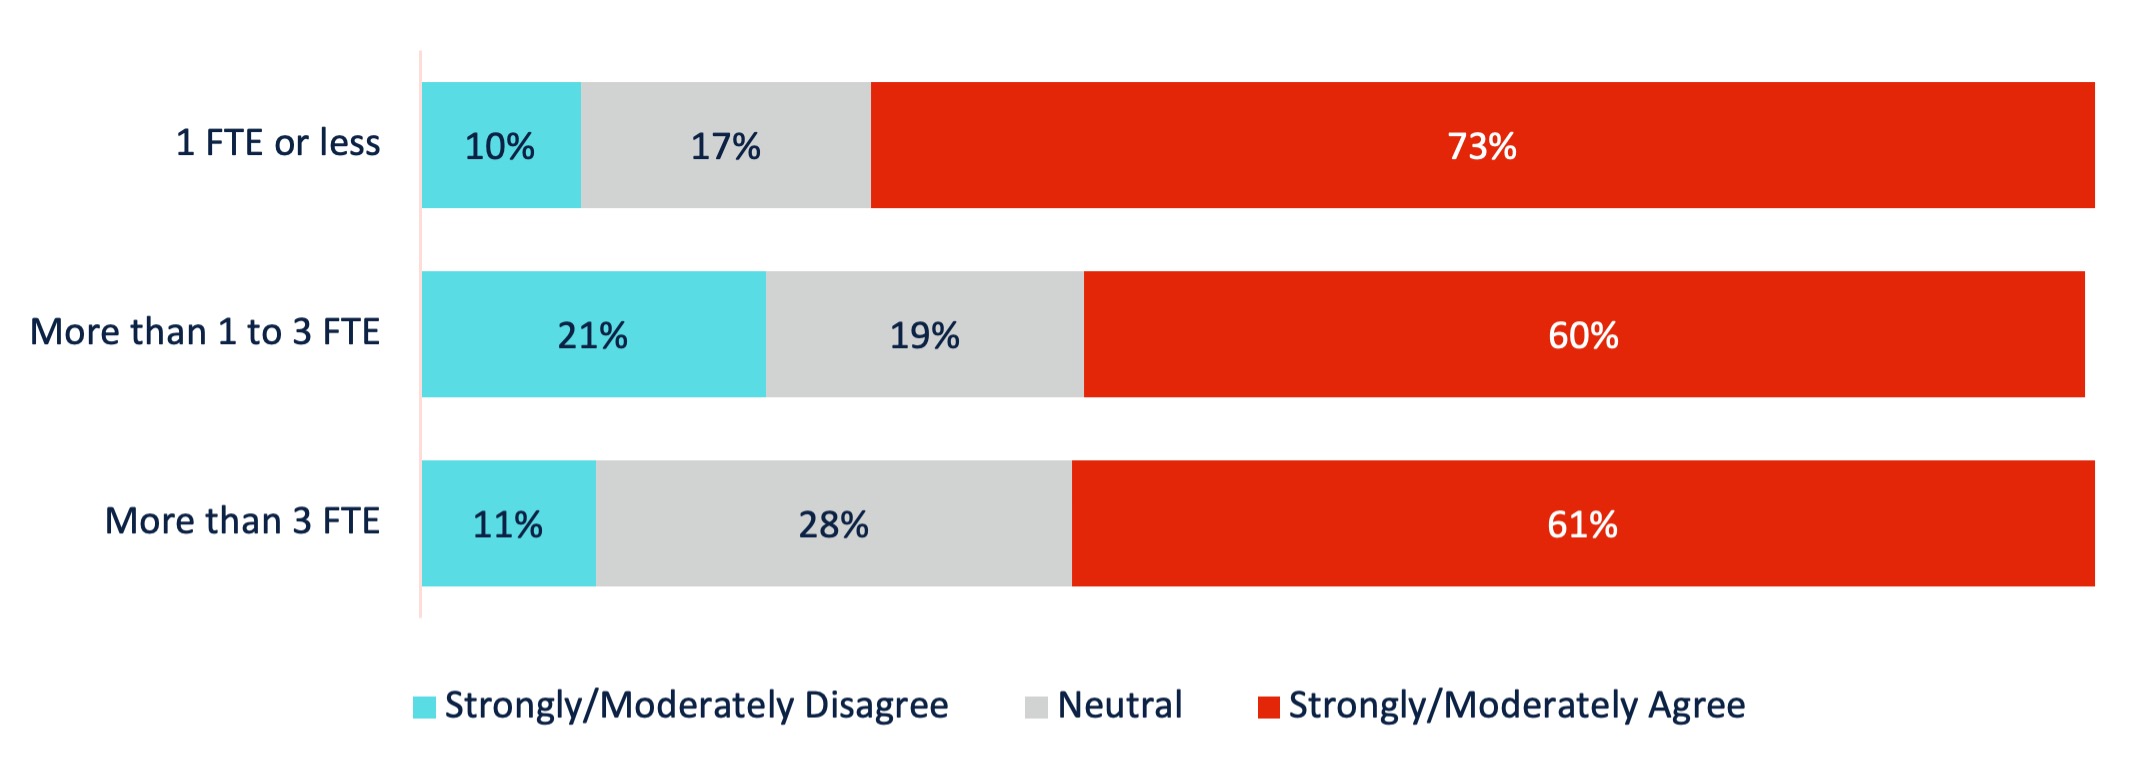
We asked respondents the degree to which they feel overwhelmed by the amount of work assigned to their offices and disaggregated results by staff size. We found that 73% of participants from very small offices (one FTE or smaller) often feel overwhelmed compared to 60% of respondents in larger offices (Chart 3).
Chart 3. Feeling Overwhelmed by Work by Office Staff Size
When asked how the IR/IE offices could improve capacity without overburdening staff, respondents note that hiring additional staff, updating technology, and creating better ways to prioritize projects would be beneficial. Below are representative comments from respondents:
“The institution can provide more/promised technical support and access to solutions. The office can make use of free and other resources to compensate for the technical resources from the institution. The office can also do a better job of tracking workload to demonstrate the need for more FTE.”
“Hire another .5-1.0 FTE, ideally. Otherwise, we need the administration to tell us what we should NOT be working on. That, however, makes me sad because I can see so many areas where we could help the college be more effective if we had the time and resources. I'd like to be proactive, not reactive.”
“I continually try to stay abreast of the field and improve my technical skills to be speedier, though even that is challenging without committing to a lot of extra hours. I've essentially limited my workload to maintain a 1.0 FTE IR office. There's so much more this office could be doing for my institution with just one additional staff member, but there is no support from leadership to expand the office at this time. I accomplish what is necessary and a little more.”
“Leveraging technology to do the heavy lifts that are currently done manually and implementing data governance so that we don't need to dedicate as much time to tracking down the data we need to fulfill requests.”
“We need to find a sustainable, easy-to-use method to track progress against projects and deadlines. I feel like we've tried everything, but nothing has stuck so far.”
“We have an adequate FTE of our staff, but not every team member has the skills necessary to allow equal distribution of IR work.”
About
AIR conducts surveys community surveys on a variety of topics to gather in-the-moment understanding from data professionals working in higher education.
Image Description
Chart 1.
Chart 1 is a bar chart showing level of agreement at responding institutions.
| Strongly/Moderately Disagree | Neutral | Strongly/Moderately Agree | |
|---|---|---|---|
| I am satisfied with the size of current workload. | 42% | 23% | 35% |
| Staff FTE is sufficient to accomplish current workload. | 53% | 11% | 36% |
| Office’s process to manage workload is adequate. | 23% | 21% | 56% |
Chart 2.
Chart 2 is a bar chart showing level of agreement at responding institutions.
| Strongly/Moderately Disagree | Neutral | Strongly/Moderately Agree | |
|---|---|---|---|
| Analytical support | 44% | 21% | 35% |
| Technical support | 41% | 18% | 41% |
| Administrative support | 34% | 24% | 42% |
Chart 3.
Chart 3 is a bar chart showing level of agreement at responding institutions.
| Strongly/Moderately Disagree | Neutral | Strongly/Moderately Agree | |
|---|---|---|---|
| More than 3 FTE | 11% | 28% | 61% |
| More than 1 to 3 FTE | 21% | 19% | 60% |
| 1 FTE or less | 10% | 17% | 73% |
Return to content