
This brief is one of a series of reports. Learn more at airweb.org/nationalsurvey.
Institutional research (IR) leaders have myriad responsibilities beyond leading the work of their units, including hiring and training new staff, managing staff, and communicating the value of their offices’ work to stakeholders and senior leaders. Many who work in IR started their careers on completely different professional trajectories. In the 2021 AIR National Survey of IR Offices, we asked IR office leaders about their educational and professional backgrounds to explore their characteristics as a group.
Profile of IR Office Leader
Nationally, IR office leaders are most likely to be between 50 and 59 years old (36% of the respondents), identify as female (55% of the respondents), and be white (85% of the respondents) (Chart 1).
Chart 1. Demographic Profile of IR Office Leader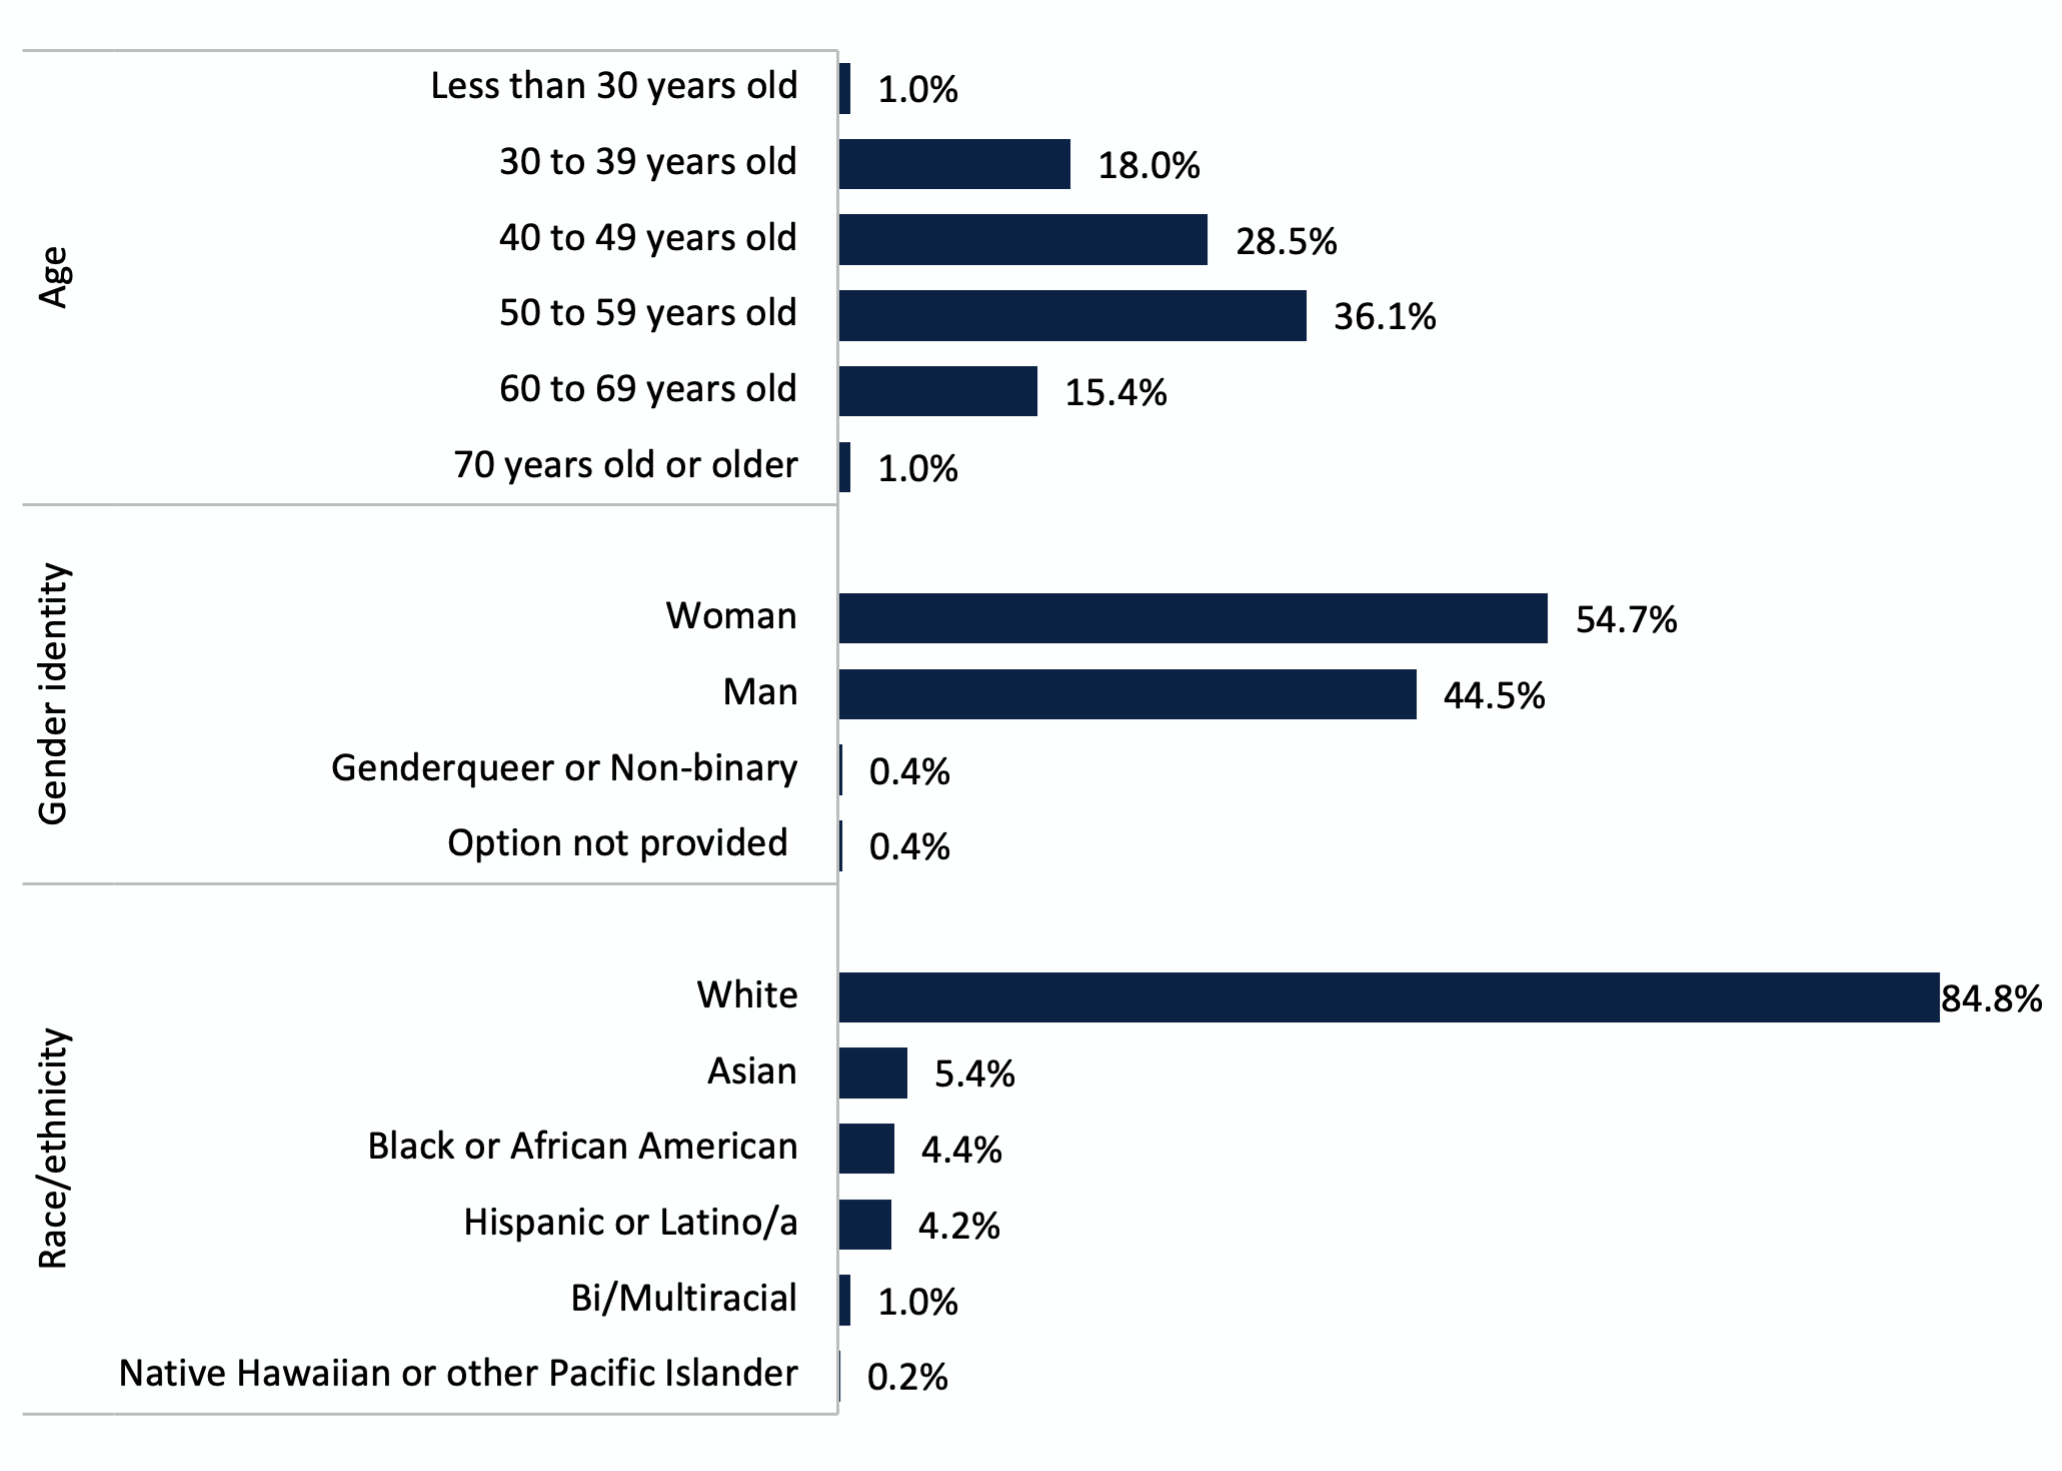
However, there are slight differences in the IR leader profile by institutional sector (Table 1). A slightly higher percentage of office leaders at public 2-year institutions are younger compared to other sectors, a slightly higher percentage of office leaders at public 4-year institutions are male in comparison to other sectors, and office leaders at private, not-for-profit, 4-year institutions are slightly more diverse in comparison.
| Demographic | All Institutions | Public 4-year | Public 2-year | Private NFP 4-year |
|---|---|---|---|---|
| Age | ||||
| Less than 30 years old | 1% | 2% | 0% | 1% |
| 30 to 39 years old | 18% | 17% | 20% | 18% |
| 40 to 49 years old | 29% | 29% | 28% | 29% |
| 50 to 59 years old | 36% | 38% | 37% | 35% |
| 60 to 69 years old | 15% | 13% | 15% | 17% |
| 70 years old or older | 1% | 1% | 2% | 1% |
| Gender identity | ||||
| Woman | 55% | 52% | 60% | 53% |
| Man | 45% | 48% | 38% | 46% |
| Genderqueer or Non-binary | 0% | 0% | 1% | 0% |
| Option not provided | 0% | 0% | 1% | 0% |
| Race/ethnicity | ||||
| White | 85% | 86% | 88% | 83% |
| Asian | 5% | 6% | 4% | 5% |
| Black or African American | 4% | 3% | 2% | 6% |
| Hispanic or Latino/a | 4% | 3% | 3% | 5% |
| Bi/Multiracial | 1% | 1% | 2% | 0% |
| Native Hawaiian or other Pacific Islander | 0% | 0% | 1% | 0% |
Office Leader Credentials and IR Certificates
Credentials for IR office leaders vary by the institutions for which they work and the responsibilities they hold. Survey data reveal that 92% of respondents have earned postgraduate degrees (Table 2). When we disaggregate the data by major institutional sector, we find that slightly more IR office leaders at public 2-year institutions hold doctoral degrees than office leaders at the 4-year institutions.
| Degree | All Institutions | Public 4-year | Public 2-year | Private NFP 4-year |
|---|---|---|---|---|
| Baccalaureate degree or lower | 8% | 7% | 7% | 9% |
| Master’s degree/specialist | 44% | 47% | 39% | 46% |
| Doctoral degree/professional practice doctorates | 48% | 47% | 54% | 45% |
Of the institutions that completed the National Survey of IR Offices in 2021, 2018, and 2015, 178 provided information about IR leaders’ highest degrees earned. Between 2015 and 2021, the percentage of leaders with postgraduate degrees at those 178 institutions rose (Table 3).
| Degree | 2021 | 2018 | 2015 |
|---|---|---|---|
| Baccalaureate degree or lower | 8% | 9% | 13% |
| Master’s degree/Specialist | 43% | 42% | 39% |
| Doctoral degree including professional practice doctorates | 49% | 49% | 47% |
Several U.S. institutions offer post-graduate certificates in IR that provide specialized, field-specific training as a supplement to or in lieu of postgraduate studies. Data from the 2021 survey show that 11% of office leaders have IR certificates; that number is consistent across institutional sector.
Relevant Work Experience
Because there is no specific degree program related to IR, it is important that office leaders have relevant or transferable experience sufficient for their roles, such as (but not limited to) other higher education fields. On average, IR office leaders have worked 19 years in higher education, 7 prior to entering IR, and 12 years in fields related to IR or institutional effectiveness (IE). Further, respondents reported, on average, working 11.5 years at their current institutions and 6.5 years leading the IR offices at those institutions.
When we disaggregate by major institutional sector, we find that IR office leaders at public 4-year institutions have slightly more work experience in higher education and IR/IE than office leaders in other sectors (Table 4).
| Experience | All Institutions | Public 4-year | Public 2-year | Private NFP 4-year |
|---|---|---|---|---|
| Working in higher education regardless of institution | 19.0 | 20.7 | 17.5 | 18.8 |
| Working in the IR/IE field regardless of institution | 12.0 | 14.0 | 10.2 | 11.8 |
| Working at current institution | 11.5 | 12.8 | 9.9 | 11.5 |
| Leading the IR/IE office at current institution | 6.5 | 6.7 | 5.5 | 7.0 |
Of the institutions that completed the National Survey of IR Offices in 2021, 2018, and 2015, 210 provided data on relevant work experience of the office leader. Compared to 2015, IR office leaders in 2021 have approximately 18 months more experience in IR/IE and have spent approximately 1 year longer at their institutions (Table 5).
| Experience | 2021 | 2018 | 2015 |
|---|---|---|---|
| Working in higher education regardless of institution | 19.6 | 18.4 | N/A |
| Working in the IR/IE field regardless of institution | 13.2 | 12.2 | 11.6 |
| Working at current institution | 12.2 | 11.3 | 10.8 |
| Leading the IR/IE office at current institution | 7.3 | 6.3 | 6.4 |
Assessment of Office Leader
We asked office leaders to evaluate themselves as leaders (Table 6). We found that nearly all leaders say they use evidence to inform their decisions, while three-fourths report that they empower their staff members to contribute to office effectiveness.
Disaggregating by institutional sector, we find that office leaders at public 4-year institutions are more likely to empower their staff to contribute to office effectiveness compared to the other two sectors.
| Statement | All Institutions | Public 4-year | Public 2-year | Private NFP 4-year |
|---|---|---|---|---|
| Office leader uses evidence to inform decisions | 92% | 93% | 90% | 92% |
| Office leader regularly assesses the Office to ensure goal attainment | 82% | 85% | 86% | 79% |
| Office leader empowers Office staff to contribute to the effectiveness of the office | 75% | 91% | 74% | 67% |
NOTE: Survey questions were asked using a 5-point Likert scale (strongly disagree, moderately disagree, neutral, moderately agree, and strongly agree). These data combine the responses from moderately and strongly agree.
Assessment of Office Culture
We asked office leaders to evaluate their office cultures (Table 7). We found that 91% of leaders say their offices’ missions are aligned with their institutions’ missions and their work is grounded in appropriate theories and methodologies. In addition, three-fourths of leaders indicate that their policies and practices are clearly articulated.
| Statement | All Institutions | Public 4-year | Public 2-year | Private NFP 4-year |
|---|---|---|---|---|
| Office mission is aligned with institutional mission | 91% | 94% | 95% | 88% |
| Office grounds its work in appropriate theories and methodologies | 91% | 92% | 91% | 90% |
| Office has a positive work environment | 88% | 87% | 86% | 89% |
| Office is well managed | 86% | 88% | 89% | 84% |
| Office supports analytics work conducted by other units | 86% | 88% | 82% | 87% |
| Office has access to data necessary to produce its work | 86% | 87% | 86% | 84% |
| Office is recognized for its institutional leadership in data and analytics | 86% | 90% | 86% | 83% |
| Office goals are clearly articulated | 81% | 82% | 87% | 76% |
| Office mission statement is clearly articulated | 76% | 84% | 76% | 71% |
| Office policies and practices are clearly articulated | 75% | 76% | 77% | 73% |
NOTE: Survey questions were asked using a 5-point Likert scale (strongly disagree, moderately disagree, neutral, moderately agree, and strongly agree). These data combine the responses from moderately and strongly agree.
Assessment of Office Resources
We asked office leaders to assess the adequacy of office resources to meet institutional expectations (Table 8). We found that most office leaders were satisfied with their hardware and space but less than half were satisfied with their staffing levels.
Disaggregating by institutional sector, we find that a higher percentage of leaders at public 4-year institutions were satisfied with their resources in comparison with leaders at the other two major sectors.
| Resource | All Institutions | Public 4-year | Public 2-year | Private NFP 4-year |
|---|---|---|---|---|
| Office hardware | 79% | 82% | 80% | 78% |
| Office space | 72% | 74% | 76% | 69% |
| Office software | 70% | 75% | 66% | 69% |
| Office staffing level | 39% | 46% | 43% | 33% |
NOTE: Survey questions were asked using a 5-point Likert scale (strongly disagree, moderately disagree, neutral, moderately agree, and strongly agree). These data combine the responses from moderately and strongly agree.
Assessment of Office Recruitment and Retainment
We asked office leaders to assess the degree to which they could recruit and retain diverse and talented staff. A majority of leaders indicate they can recruit and retain talented staff, but fewer reported that they can recruit and retain a diverse staff.
Disaggregating by institutional sector, we find that a higher percentage of leaders at public 4-year institutions indicated they could recruit and retain diverse staff compared to the other two sectors.
| Statement | All Institutions | Public 4-year | Public 2-year | Private NFP 4-year |
|---|---|---|---|---|
| Office can retain talented staff | 64% | 72% | 63% | 59% |
| Office can recruit talented staff | 51% | 57% | 50% | 49% |
| Office can recruit a diverse staff | 43% | 56% | 39% | 37% |
| Office can retain a diverse staff | 43% | 60% | 38% | 36% |
NOTE: Survey questions were asked using a 5-point Likert scale (strongly disagree, moderately disagree, neutral, moderately agree, and strongly agree). These data combine the responses from moderately and strongly agree.
Methodology
The 2021 AIR National Survey of IR Offices attempted to survey IR office leaders at more than 3,000 postsecondary degree-granting institutions. Institutions of all sectors, types of control, and sizes were included in the sample. In total, responses were collected from 1,142 institutions, and 554 of those institutions completed the survey in full. To ensure comparable results, incomplete responses are excluded from this report. In addition, responses from for-profit institutions, administrative units, international institutions, private not-for-profit 2-year institutions, and institutions in U.S. territories are excluded due to low response rates.
The findings presented in this report are based on 520 responses that represent U.S. postsecondary, degree-granting institutions at public 4-year (146 institutions), public 2-year (125 institutions), or private not-for-profit 4-year institutions (249 institutions).
Suggested Citation
Jones, D., Keller, C., & Raza, Z., (2022). 2021 AIR National Survey of IR Offices: IR Office Leader Characteristics [Report]. Association for Institutional Research. www.airweb.org/NationalSurvey.
Long Description
Chart 1. Demographic Profile of IR Office Leader
Chart 1 is a bar chart displaying aggregate percentages of IR office leader answers to demographic profile questions. The chart is divided into three sections; Race/ethnicity, Gender identity, and Age. Data. Numerical values presented on the image:
| Native Hawaiian or other Pacific Islander | 0.2% |
|---|---|
| Bi/Multiracial | 1.0% |
| Hispanic or Latino/a | 4.2% |
| Black or African American | 4.4% |
| Asian | 5.4% |
| White | 84.8% |
| Option not provided | 0.4% |
|---|---|
| Genderqueer or Non-binary | 0.4% |
| Man | 44.5% |
| Woman | 54.7% |
| 70 years old or older | 1.0% |
|---|---|
| 60 to 69 years old | 15.4% |
| 50 to 59 years old | 36.1% |
| 40 to 49 years old | 28.5% |
| 30 to 39 years old | 18.0% |
| Less than 30 years old | 1.0% |
Copyright © Association for Institutional Research 2021
Date: 2021
Pages: 8