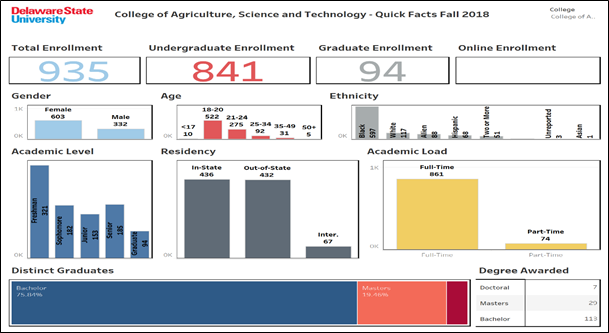
Facts at a Glance Dashboard
Each year, our Institutional Effectiveness (IE) office publishes an annual report for our Academic Affairs unit, which is one of five administrative divisions at Delaware State University. The Office of the Provost and Executive Vice President for Academic Affairs oversees all operations of the Division of Academic Affairs and is responsible for the university’s colleges and departments, the additional locations, and related academic activities in coordination with the Office of the President. Our institutional research intern, Malik Henry, created a facts-at-a-glance dashboard page in Tableau to be published in the annual report. This dashboard allows you to filter by overall university or by one of the colleges. It gives each of the colleges a snapshot of their overall enrollment demographics for a fall or spring period. Based on this project, we are now working to provide a digital fact book to be used for internal and external audiences. Below is an example of quick facts for one of the colleges for fall 2018.
View full PDF of quick facts for each college

