How Much Time Do You Spend Communicating with Stakeholders?
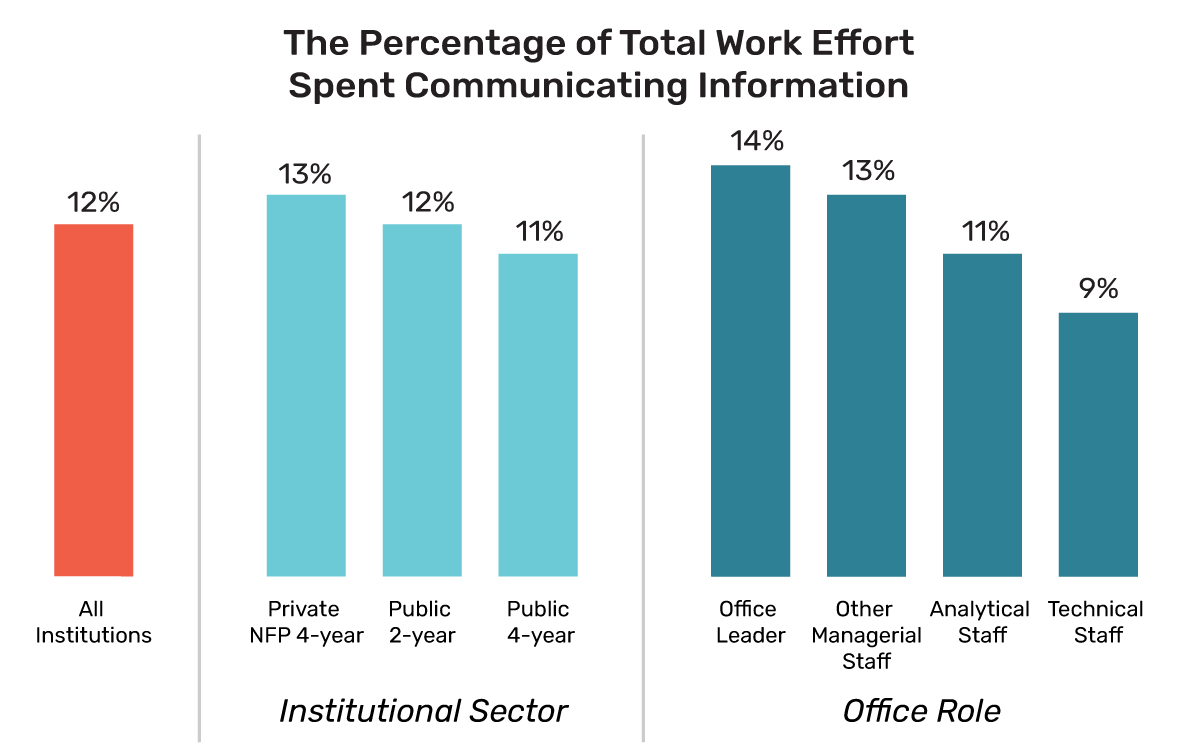
Data and analytics professionals like those in institutional research and institutional effectiveness produce information to support decision making. On average, 26% of time is spent on data collection and management and 19% on basic analytics. The third largest area of time spent (12% on average) is communicating information to stakeholders (see chart).
If we disaggregate those results by institutional sector, we find that IR offices at private, not-for-profit, 4-year institutions spend slightly more time communicating than their colleagues at public institutions. And if we disaggregate those results by office role, we find that office leaders spend more time communicating information compared to other office roles..

What is the National Survey of IR Offices?
The National Survey is a nationally representative, longitudinal study of the function of institutional research (IR) in higher education.
Learn More About the Survey View More Data Bites
Long Description
Overview
The chart shows percentages of work effort spent communicating information for all responding institutions and then disaggregates results by Institutional sector and office role.
Values
All Institutions: 12%. By Institutional Sector: Private NFP 4-year 13%, Public 2-year 12%, Public 4-year 11%. By Office Role: Office Leader 14%, Other Managerial Staff 13%, Analytical Staff 11%, Technical Staff 9%.
