
Login trouble? Use this link instead.
IR Office Staff Job Functions
This brief is one of a series of reports. Learn more at airweb.org/nationalsurvey.
An effective institutional research (IR) office leader understands the need to manage the amount of staff time devoted to various job functions to meet stakeholders’ expectations and to achieve goals. The 2018 AIR National Survey of IR Offices explored time spent on specific types of work and the associated staff salary expenses.
Time Spent on Job Functions by Staff Role
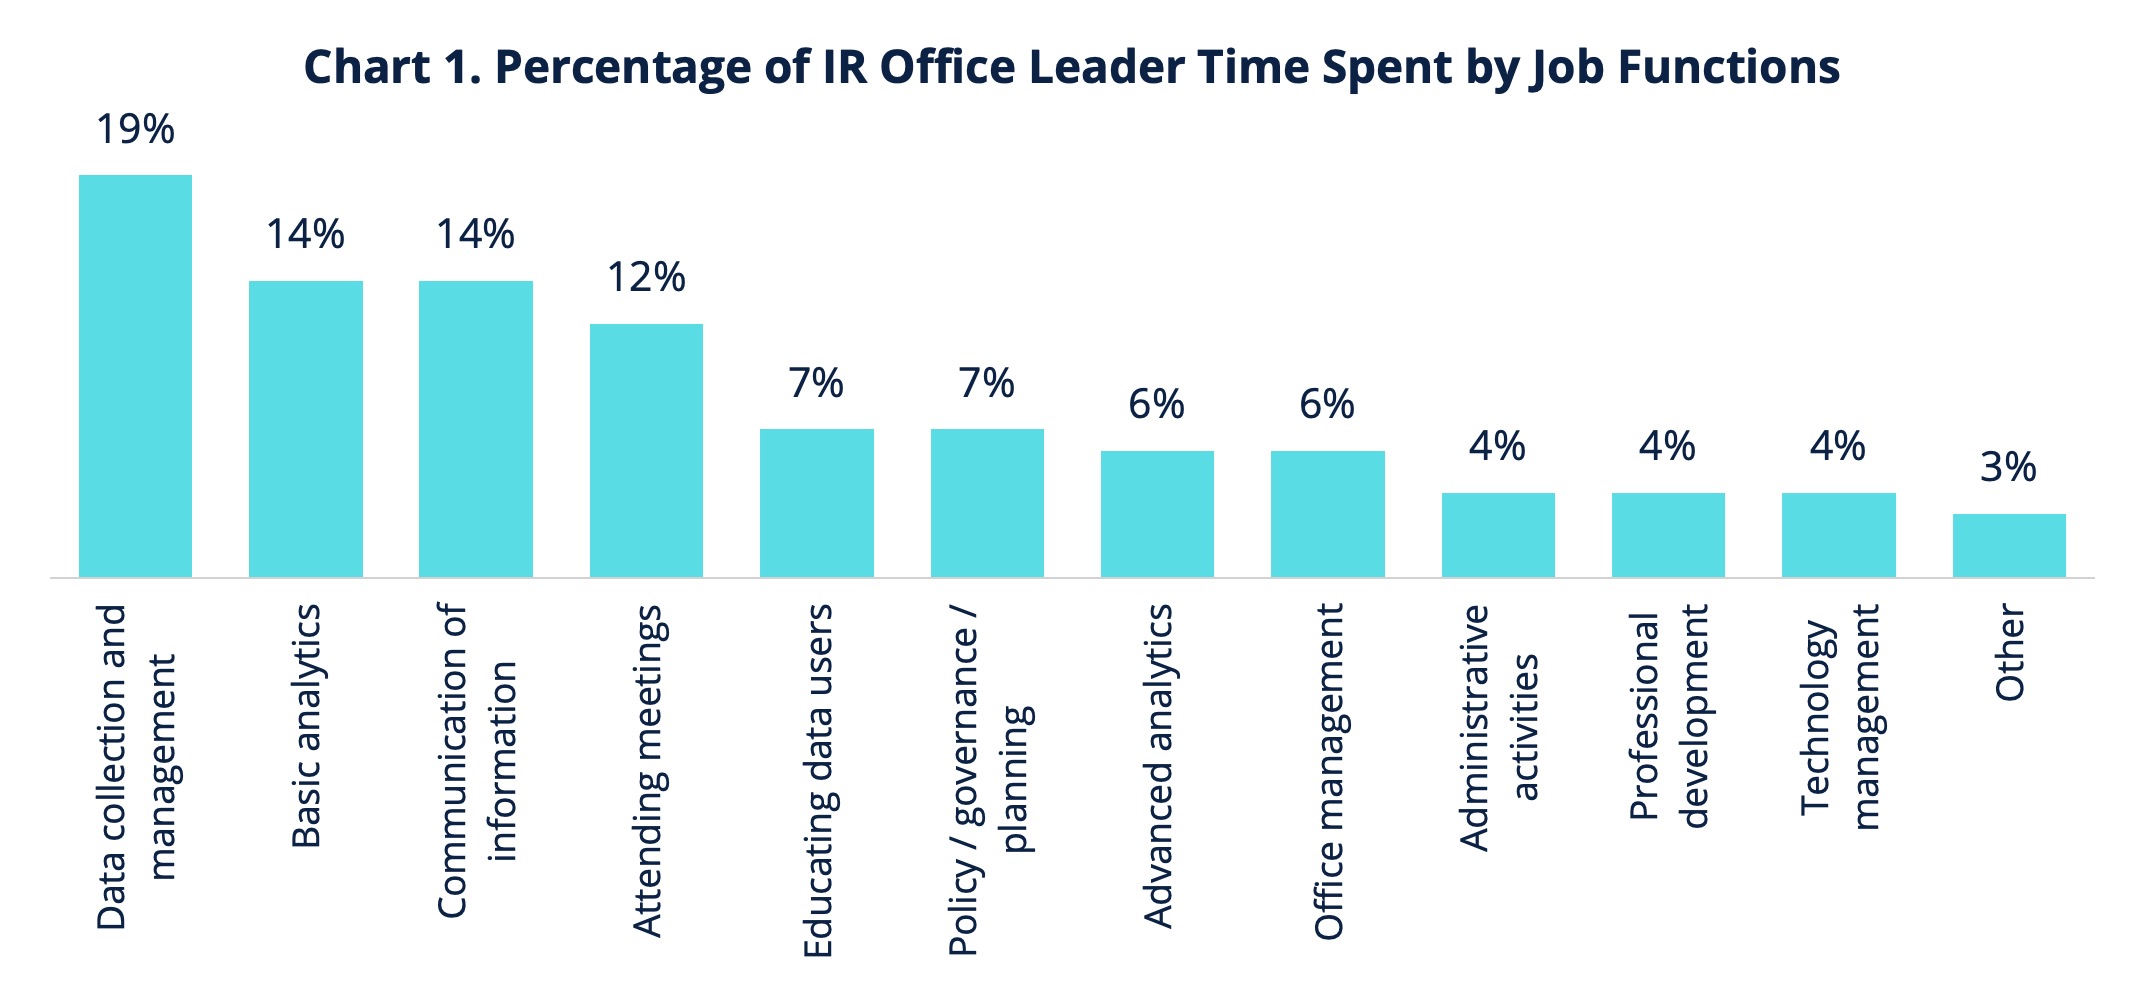
We asked IR office leaders to estimate the percentage of time they devote to daily job functions. Nearly half of their time (47%) is spent performing data collection and management, basic analytics, and communicating results (Chart 1).
When we disaggregate these data by major institutional sector1 (i.e., public 4-year, public 2-year, and private not-for-profit 4-year institutions), we find slight differences (Table 1). For example, IR office leaders at private not-for-profit 4-year institutions spend more time in data collection and management compared to their public sector colleagues.
| Job Function | All Institutions (n = 543) | Public 4-year (n = 164) | Public 2-year (n = 125) | Private NFP 4-year (n = 254) |
|---|---|---|---|---|
| Data collection and management | 19% | 14% | 18% | 23% |
| Basic analytics | 14% | 13% | 14% | 15% |
| Communication of information | 14% | 15% | 14% | 14% |
| Attending meetings | 12% | 15% | 13% | 10% |
| Educating data users | 7% | 8% | 7% | 7% |
| Policy/governance/planning | 7% | 7% | 9% | 6% |
| Advanced analytics | 6% | 6% | 5% | 6% |
| Office management | 6% | 8% | 5% | 5% |
| Administrative activities | 4% | 5% | 4% | 3% |
| Professional development | 4% | 4% | 5% | 4% |
| Technology management | 4% | 3% | 3% | 4% |
| Other | 3% | 2% | 4% | 4% |
We also asked IR office leaders to estimate the percentage of time spent on various job functions by staff role (Table 2). Of six key staff roles,2 four staff roles spend the largest amount of time on data collection and management: office leader, associate/assistant directors, analytical staff, and student staff. Technical staff spend their largest segments of time on technology management while administrative support staff spend their largest segments of time on administrative activities.
| Job Function | Office Leader | Assoc/ Asst Directors | Analytical | Technical | Admin Support | Student |
|---|---|---|---|---|---|---|
| Data collection and management | 19% | 21% | 30% | 24% | 19% | 41% |
| Basic analytics | 14% | 14% | 24% | 16% | 6% | 26% |
| Communication of information | 14% | 13% | 11% | 9% | 8% | 7% |
| Attending meetings | 12% | 9% | 5% | 5% | 5% | 1% |
| Educating data users | 7% | 8% | 5% | 5% | 2% | 1% |
| Policy/governance/planning | 7% | 5% | 2% | 2% | 1% | 0% |
| Advanced analytics | 6% | 6% | 8% | 4% | 0% | 3% |
| Office management | 6% | 5% | 1% | 1% | 15% | 0% |
| Administrative activities | 4% | 4% | 2% | 1% | 32% | 3% |
| Professional development | 4% | 5% | 5% | 4% | 3% | 2% |
| Technology management | 4% | 6% | 4% | 25% | 2% | 2% |
| Other | 3% | 4% | 3% | 4% | 7% | 14% |
Annual Staff Salary Cost per Job Function
Staff compensation is typically one of the largest expenses an IR office incurs. As such, it is important to understand how office staff spend their time and how that time translates to salary expenditures. Awareness of staff compensation costs associated with specific job functions informs capacity and budget decisions and contributes to more efficient and effective stewardship of institutional resources.
Analytic staff and office leaders’ time are the greatest salary expenses for the average IR office, as highlighted in Table 3.
| IR Staff Role | Average Annual Salary | Average FTE | Average Annual Salary Expenses |
|---|---|---|---|
| Office Leader | $ 96,151 | 0.96 | $ 92,055 |
| Other Managerial Staff | $ 79,478 | 0.40 | $ 31,934 |
| Analytical Staff | $ 60,952 | 1.60 | $ 97,455 |
| Technical Staff | $ 65,445 | 0.36 | $ 23,661 |
| Administrative Support Staff | $ 46,941 | 0.27 | $ 12,790 |
| Student Staff | $ 19,036 | 0.34 | $ 6,551 |
Note: Salary expenses per staff role were calculated by multiplying the average annual salary by the average full-time equivalent (FTE) for each staff role.3
We also explored salary expenses associated with each job function. Chart 2 shows that the average IR office annually devotes nearly $64,000 to staff salaries for data collection and management, $47,000 for basic analytics, and nearly $32,000 for communication of information.

Note: Salary expenses were calculated by multiplying the percentage of time spent on various job functions by staff role in Table 2 with the average salary expenses in Table 3.
Following the same logic, we calculated the average salary expenses per job function by major institutional sector (Table 4). IR offices at public 4-year institutions allocate nearly $97,000 to staff salaries to collect and manage data, and nearly $76,000 for basic analytics; those values are significantly higher than the other two sectors’ expenditures.
| Job Function | All Institutions | Public 4-year | Public 2-year | Private NFP 4-year |
| Data collection and management | $63,879 | $96,571 | $61,333 | $58,045 |
|---|---|---|---|---|
| Basic analytics | $47,025 | $75,521 | $46,914 | $38,906 |
| Communication of information | $31,985 | $49,456 | $32,009 | $28,556 |
| Attending meetings | $21,104 | $34,020 | $23,775 | $16,857 |
| Educating data users | $16,014 | $27,683 | $16,205 | $12,463 |
| Technology management | $15,956 | $32,875 | $12,589 | $11,276 |
| Advanced analytics | $15,535 | $27,370 | $12,730 | $13,252 |
| Professional development | $11,533 | $20,299 | $10,899 | $8,942 |
| Administrative activities | $11,127 | $17,469 | $13,513 | $8,886 |
| Policy/governance/planning | $10,408 | $16,012 | $13,611 | $8,032 |
| Office management | $10,089 | $18,357 | $9,869 | $7,579 |
| Other | $9,790 | $11,046 | $10,815 | $10,341 |
Likewise, we found the average salary expenses associated with each job function for each staff role (Table 5). The average IR office dedicates more than $17,000 of the leader’s salary to data collection and management and nearly $13,000 to basic analytics.
| Job Function | Total | Office Leader | Assoc/ Asst Directors | Analytical | Technical | Admin Support | Student |
|---|---|---|---|---|---|---|---|
| Data collection and management | $63,879 | $17,166 | $6,731 | $29,083 | $5,875 | $2,367 | $2,656 |
| Basic analytics | $47,025 | $12,912 | $4,352 | $23,585 | $3,726 | $737 | $1,713 |
| Communication of information | $31,985 | $13,158 | $4,067 | $11,181 | $2,095 | $998 | $486 |
| Attending meetings | $21,104 | $11,165 | $2,777 | $5,302 | $1,217 | $582 | $61 |
| Educating data users | $16,014 | $6,549 | $2,586 | $5,264 | $1,266 | $312 | $38 |
| Technology management | $15,956 | $3,372 | $2,054 | $4,197 | $5,918 | $275 | $141 |
| Advanced analytics | $15,535 | $5,311 | $1,785 | $7,332 | $855 | $31 | $221 |
| Professional development | $11,533 | $3,756 | $1,622 | $4,616 | $1,023 | $393 | $124 |
| Administrative activities | $11,127 | $3,662 | $1,340 | $1,550 | $217 | $4,153 | $205 |
| Policy/governance/planning | $10,408 | $6,419 | $1,522 | $1,830 | $476 | $159 | $0 |
| Office management | $10,089 | $5,371 | $1,731 | $913 | $168 | $1,874 | $31 |
| Other | $9,790 | $3,213 | $1,368 | $2,601 | $824 | $910 | $874 |
These findings highlight key considerations for the ways in which salaries are allocated, including time and capacity by role, and salary levels by job functions and activities. The goal of providing this information is to establish a foundation for IR offices to explore their salary and job function data and inform conversations about the way office responsibilities are assigned, goals are designed and pursued, and whether internal and external solutions are employed (e.g., software, outsourcing, collaboration with other institutional units, etc.).
Methodology
The 2018 AIR National Survey of IR Offices attempted to survey IR office leaders at more than 3,000 postsecondary degree-granting institutions. Institutions of all sectors, types of control, and sizes were included in the sample. In total, responses represented 1,167 institutions, and 566 of those institutions completed the survey in full. To ensure comparable results, incomplete responses are excluded from this report. In addition, responses from for-profit institutions, administrative units, international institutions, private not-for-profit 2-year institutions, and institutions in U.S. territories are excluded due to low response rates.
This Report
The findings presented in this report are based on 543 responses that represent U.S. postsecondary, degree-granting institutions at public 4-year, public 2-year, or private not-for-profit 4-year institutions.
- See methodology section at end of this report for more information.
- See 2018 National Survey brief IR Office Staff Roles for more details about these six roles.
- See 2018 National Survey brief IR Office Staff Salaries for more information about average salaries by staff role, and brief IR Office Staff Roles for more details about staff FTE.
Related Content
2018 AIR National Survey of IR Offices: Topic Briefs