IR Office Staff Roles
This brief is one of a series of reports. Learn more at airweb.org/nationalsurvey.
The responsibilities and duties that constitute institutional research (IR) vary from one institution to another; however, IR and data professionals are essential to accomplish the work. In the 2018 AIR National Survey of IR Offices, we asked IR office leaders to tell us about staff roles and staff sizes, and to evaluate the adequacy of their staff sizes.
Roles and Full-Time Equivalent
The 2018 National Survey revealed that nearly all IR offices represented in the survey data have official office leaders with titles of director of institutional research, associate provost for institutional research and effectiveness, or similar. Likewise, most IR offices have analytical staff.
However, only about one in four IR offices have roles beyond analytical staff, such as associate/assistant directors or technical, administrative, and student staff.1
There are substantial differences in IR offices’ staff roles by major sector:2 public 4-year, public 2-year, and private not-for-profit 4-year. While most IR offices have leaders regardless of sector, public 4-year institutions are more likely to have additional staff roles than public 2-year institutions and private not-for-profit 4-year institutions (Table 1).
| Staff Role | All Institutions (n = 543) | Public 4-year (n = 164) | Public 2-year (n = 125) | Private NFP 4-year (n = 254) |
|---|---|---|---|---|
| Office Leader | 95% | 96% | 94% | 95% |
| Associate/Assistant Directors | 26% | 40% | 19% | 19% |
| Analytical Staff | 63% | 85% | 62% | 49% |
| Technical Staff | 20% | 35% | 20% | 10% |
| Administrative Support Staff | 27% | 38% | 34% | 17% |
| Student Staff | 27% | 40% | 8% | 27% |
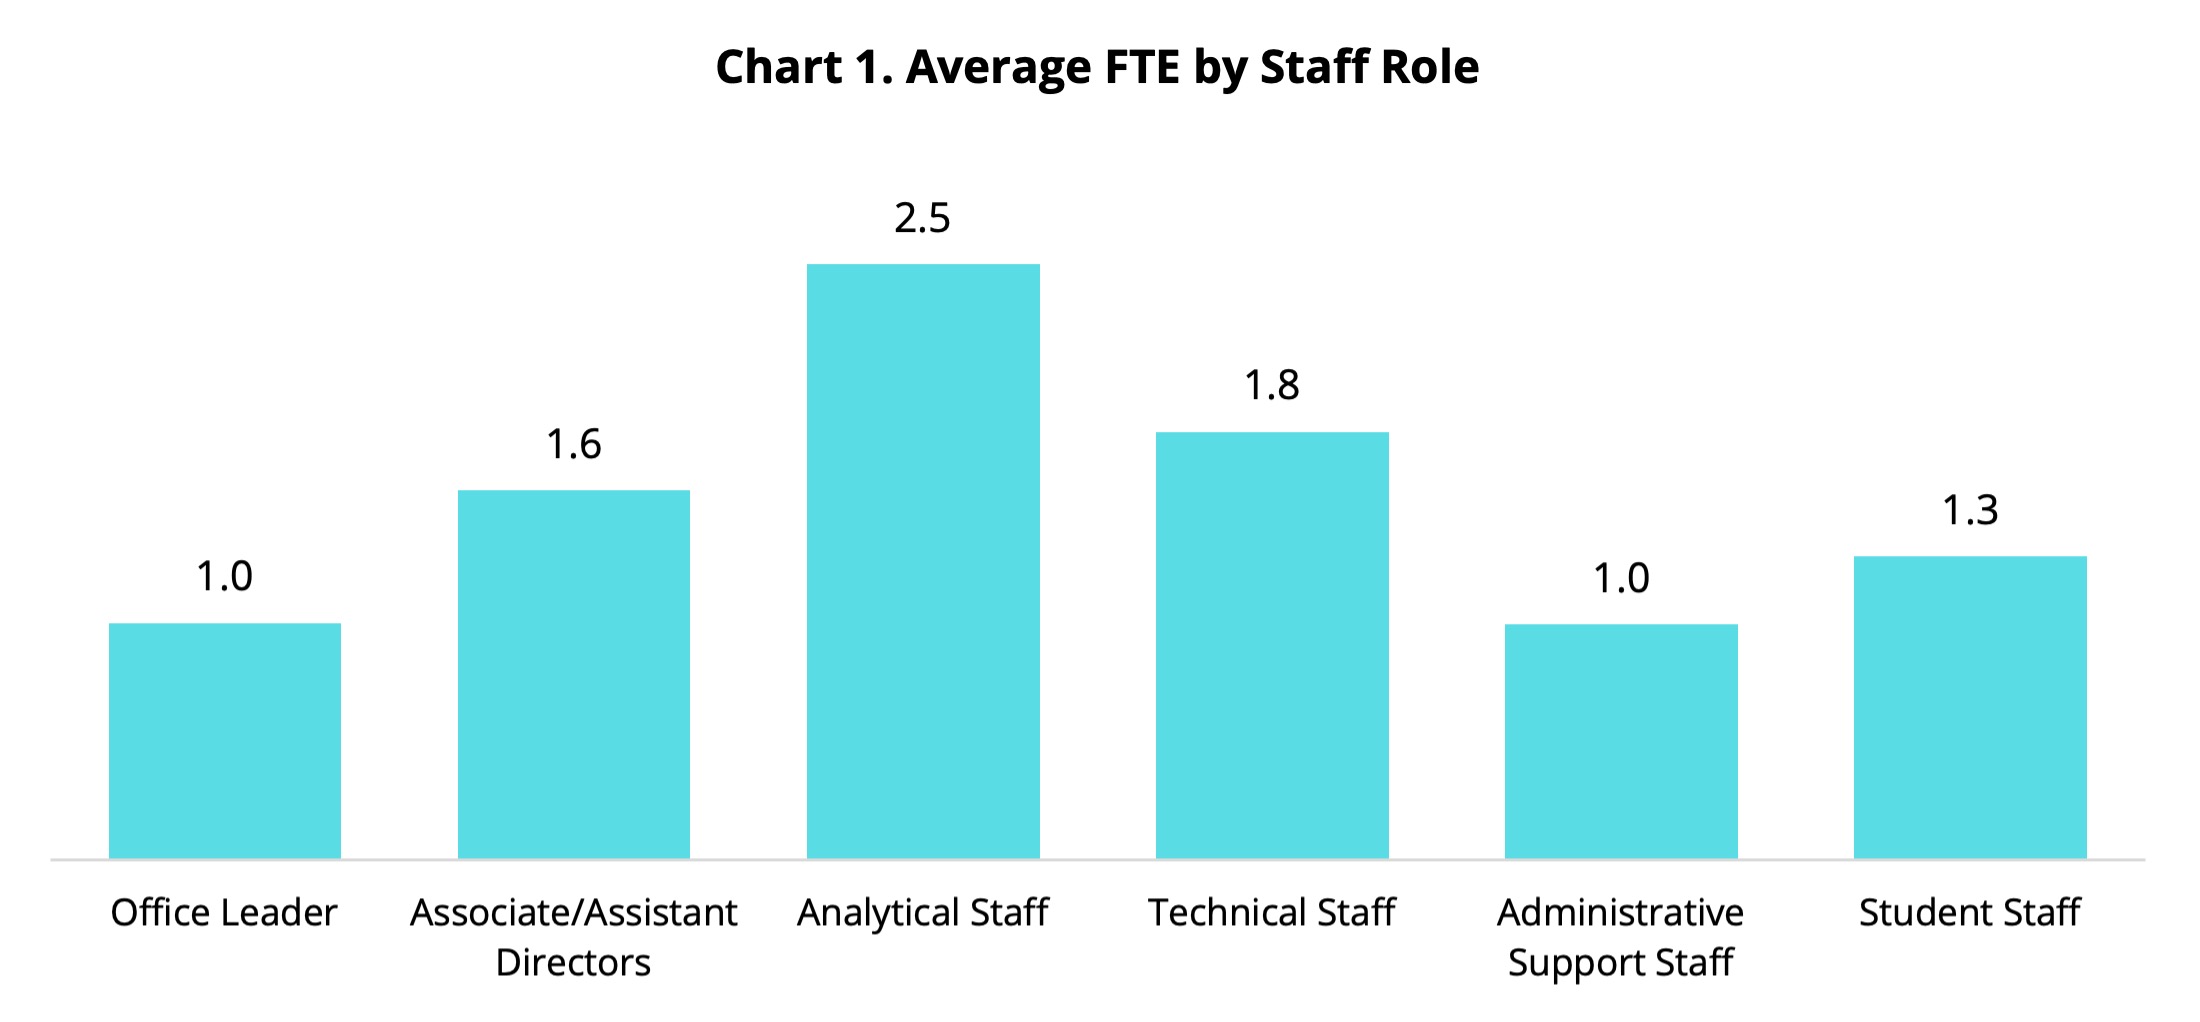
We calculated the average full-time equivalent (FTE) staff role by multiplying the percentage of IR offices with the specific role type by the average staff FTE per role. Across all sectors represented, staff roles vary in size. They range from an FTE of 1.0 for administrative support staff to an FTE of 2.5 for analytical staff (Chart 1).;

Note: FTE = full-time equivalent.
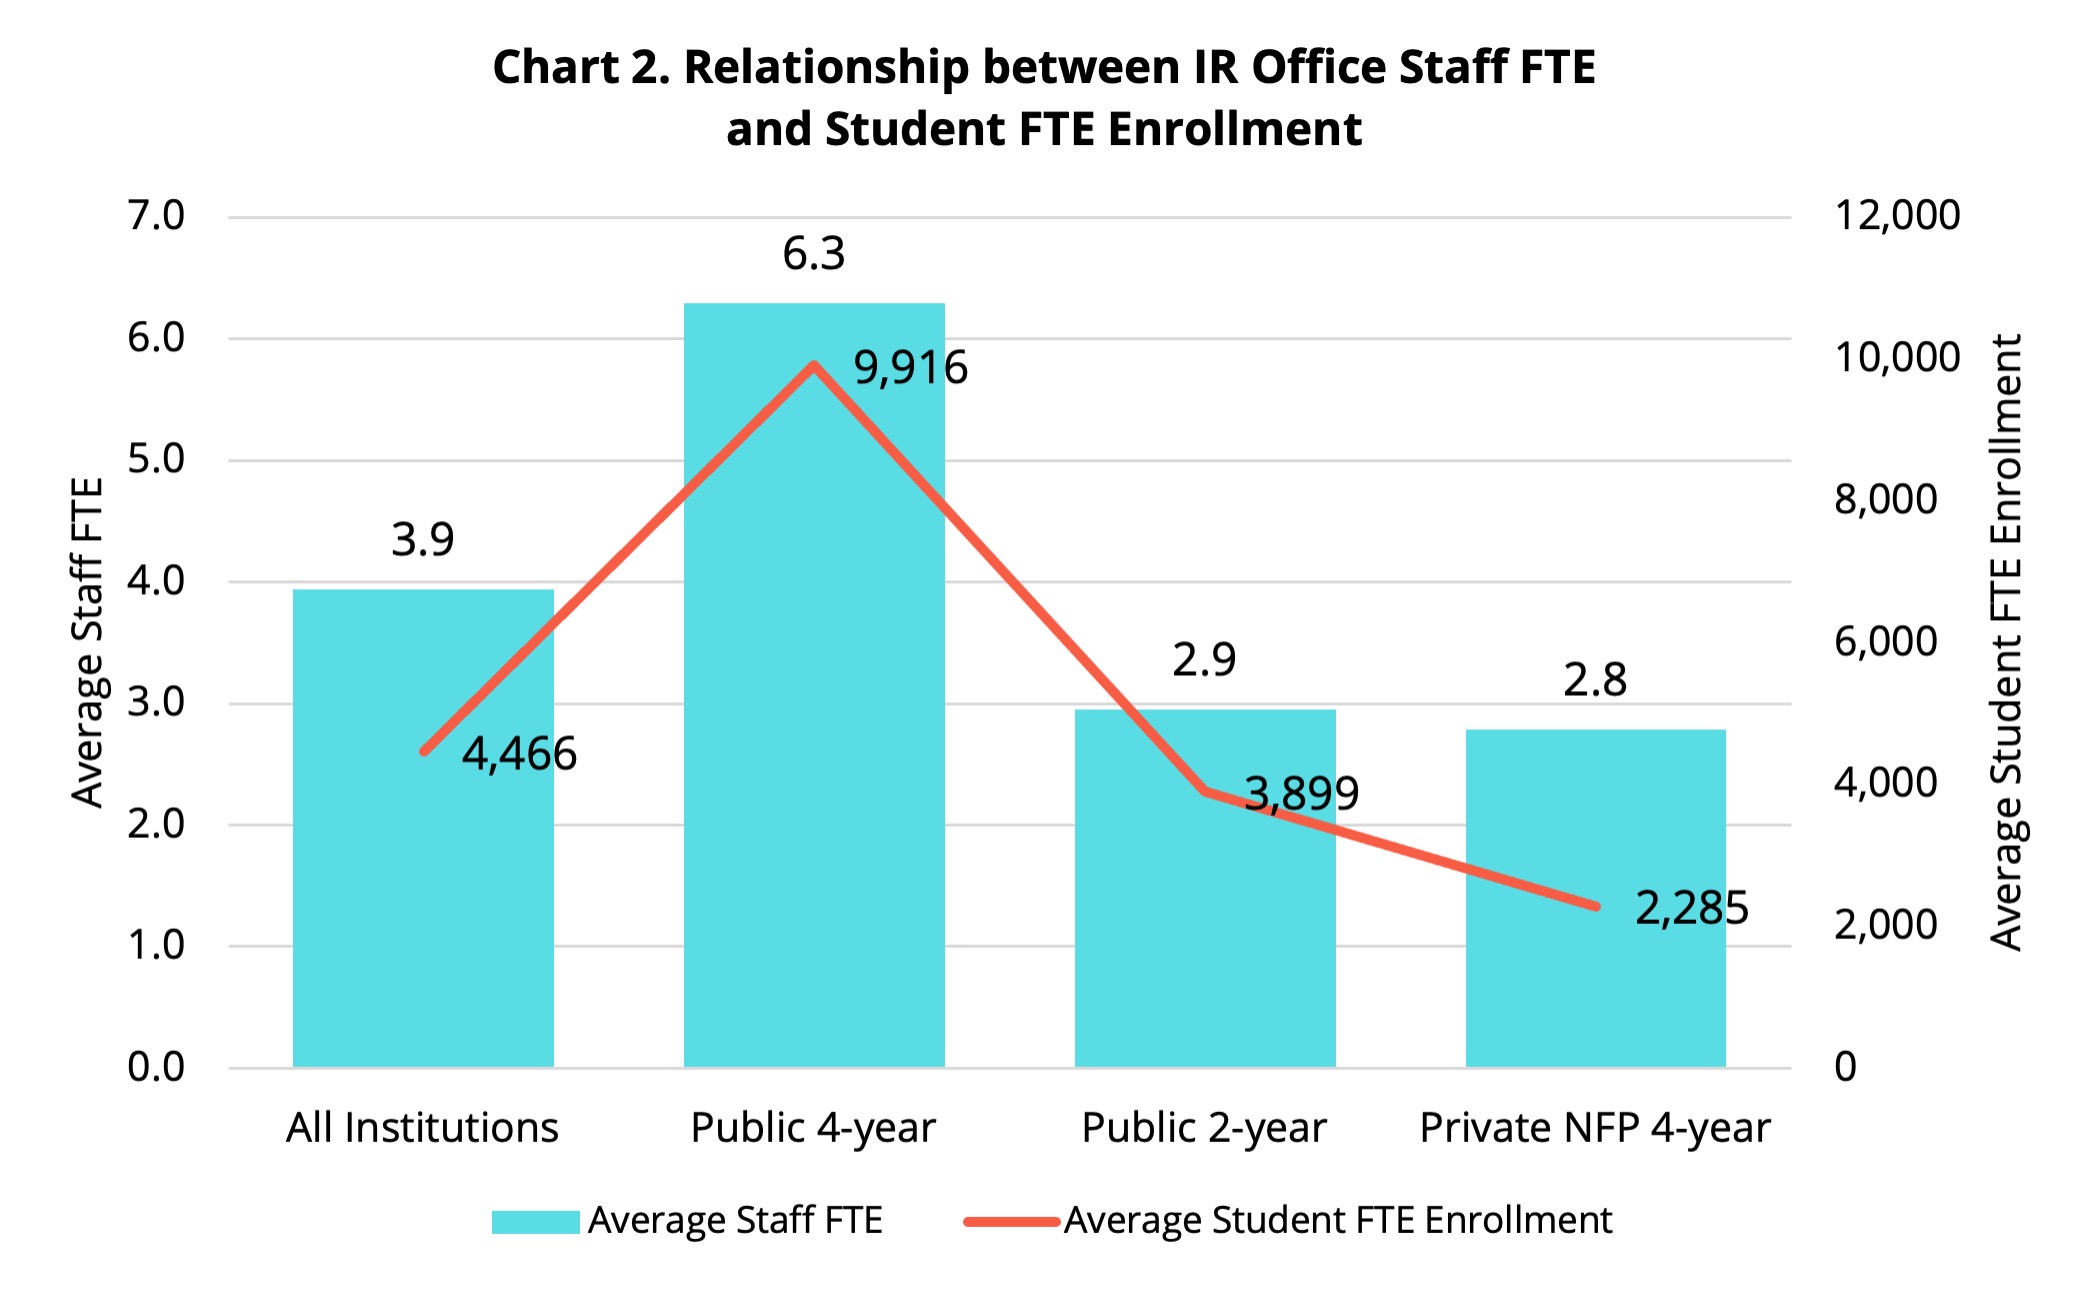
The average IR office has a staff FTE of 3.9, ranging from a high of 6.3 FTE at the average public 4-year institution to a low of 2.8 FTE at the average private not-for-profit 4-year institution (Table 2).
| Staff Role | All Institutions | Public 4-year | Public 2-year | Private NFP 4-year |
| Office Leader | 1.0 | 1.0 | 0.9 | 1.0 |
|---|---|---|---|---|
| Associate/Assistant Directors | 0.4 | 0.7 | 0.3 | 0.2 |
| Analytical Staff | 1.6 | 2.8 | 1.2 | 0.9 |
| Technical Staff | 0.4 | 0.9 | 0.2 | 0.1 |
| Administrative Support Staff | 0.3 | 0.4 | 0.3 | 0.2 |
| Student Staff | 0.3 | 0.5 | 0.0 | 0.4 |
| TOTAL | 3.9 | 6.3 | 2.9 | 2.8 |
Note: FTE = full-time equivalent.
Relationship between Staff FTE and Institutional Enrollment
The survey findings indicate that IR office staff FTE correlates with institutional enrollment. Chart 2 shows the average IR office staff FTE by sector overlaid with the average student FTE enrollment in aggregate for the three major sectors. Of the institutions that responded to the survey, public 4-year institutions have nearly triple the enrollment of public 2-year institutions, and their IR offices have about triple the staff FTE. Further, public 4-year institutions have more than quadruple the enrollment of private not-for-profit 4-year institutions and much larger IR office staffs.

Note: FTE = full-time equivalent. Enrollment data reported from the 2017 Integrated Postsecondary Education Data System (IPEDS).
Table 3 presents the average IR office staff FTE by institutional enrollment (e.g., all enrolled degree-seeking student FTEs) and institutional sector. Smaller institutions have smaller IR office staff sizes and larger institutions have much larger IR office staff sizes.
| Institutional Enrollment | All Institutions | Public 4-year | Public 2-year | Private NFP 4-year |
|---|---|---|---|---|
| Fewer than 3,000 student FTE | 1.7 | 2.1 | 1.4 | 1.8 |
| 3,000 to 4,999 student FTE | 3.0 | 4.2 | 3.1 | 2.6 |
| 5,000 to 9,999 student FTE | 4.4 | 4.5 | 3.8 | 4.9 |
| 10,000 to 19,999 student FTE | 5.7 | 5.9 | 5.7 | 5.1 |
| 20,000 or more student FTE | 11.2 | 10.9 | 9.3 | 16.7 |
Note: FTE = full-time equivalent.
Evaluation of Staff Size by IR Office Leader
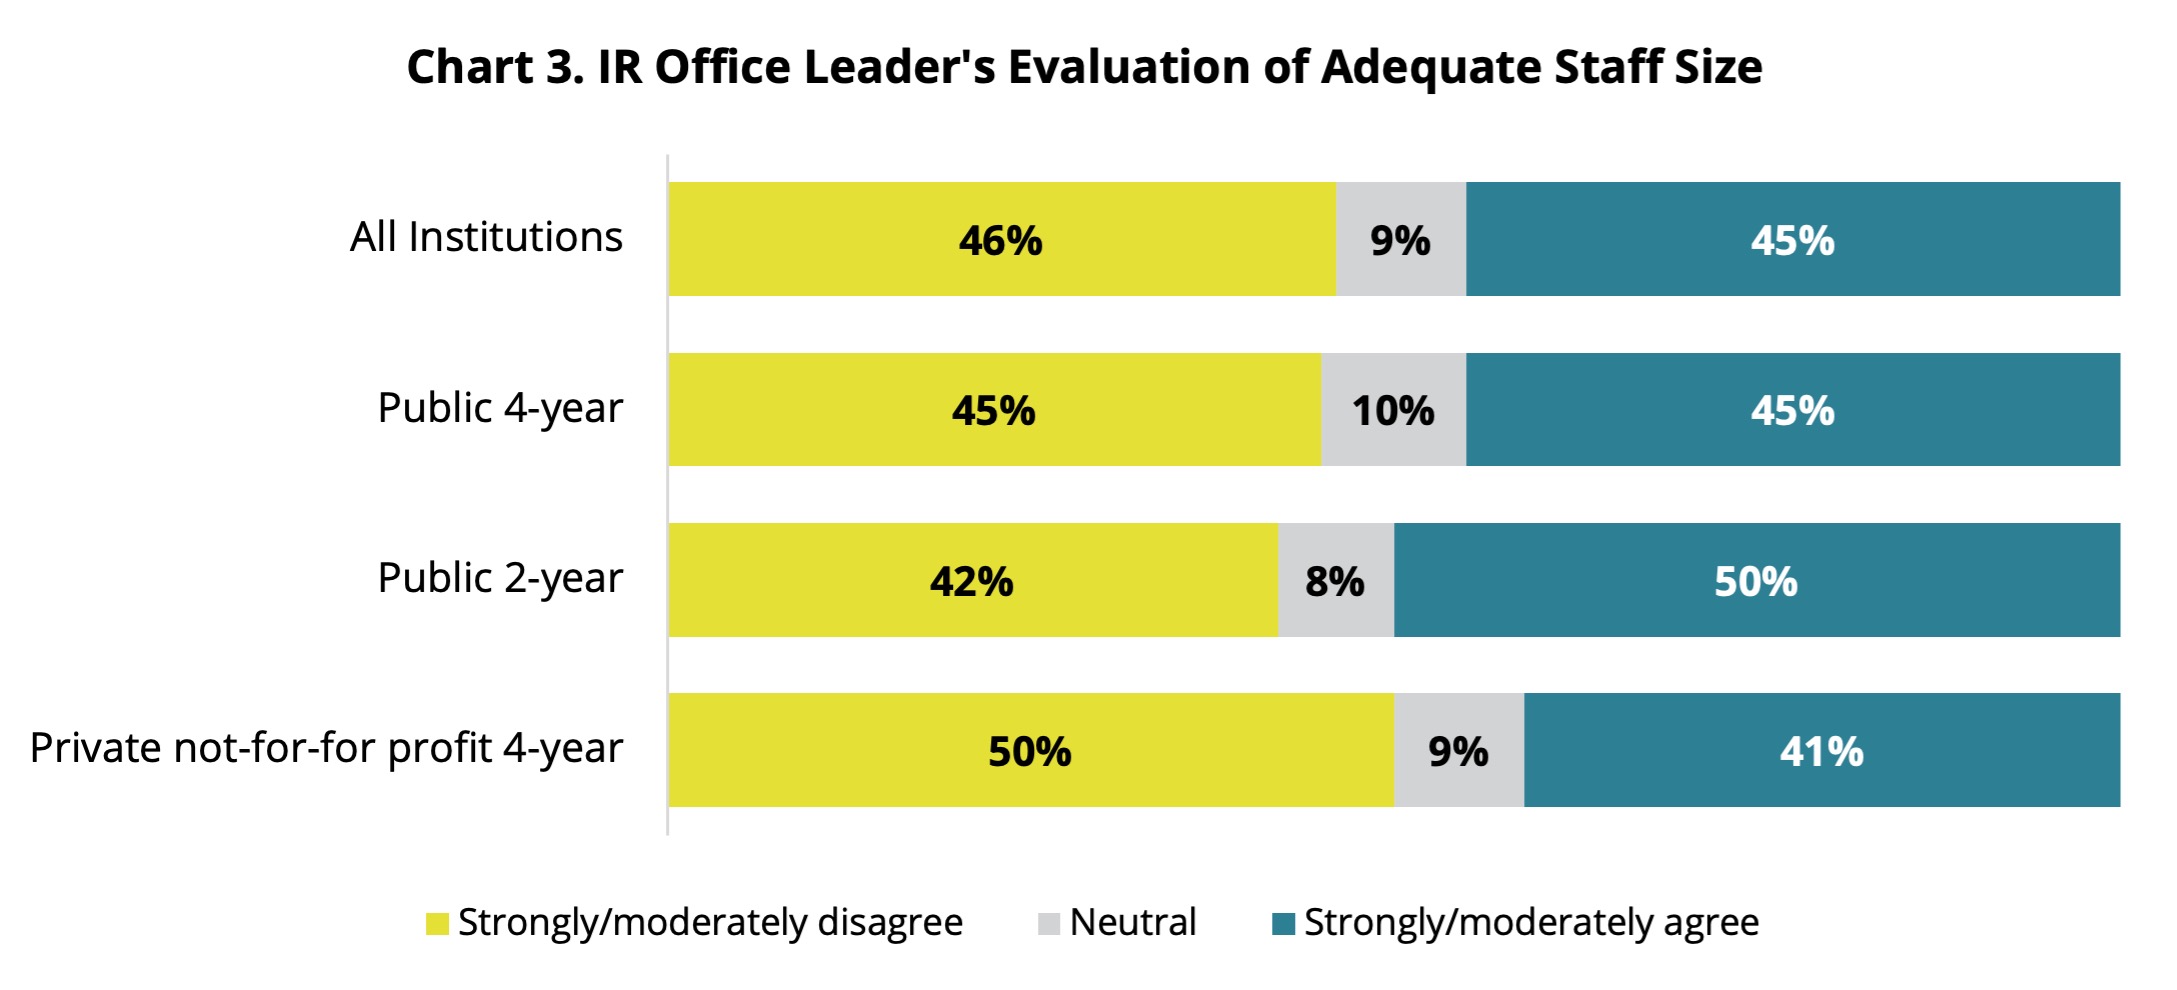
We asked office leaders to indicate their levels of agreement with the statement, “Office staffing is adequate to meet institutional expectations.” Respondents were almost evenly split on whether they believed their office staffing was adequate
to meet institutional expectations (Chart 3).

Only 34% of leaders of IR offices that are primarily reporting units (i.e., more than 50% of their work is spent producing compliance and institutional reports) are satisfied with staff size with an average staff FTE of 2.9. By contrast, 48% of leaders of IR offices with broader portfolios of work are satisfied with staff size with an average staff FTE of 4.2.
Changes in Staff FTE from 2015 to 2018
Of the 543 IR offices that participated in the 2018 National Survey, 376 also completed the 2015 National Survey. Among those 376 institutions, 343 provided staff FTE data for both surveys.
Of the 343 institutions, the average office size was approximately the same between 2015 and 2018 (lost or gained 0.49 FTE). In 2015, institutions had average staff FTEs of 3.98; by 2018, the average had increased to 4.08 (a net increase of 0.1 staff FTE). Yet only 39% of IR offices realized increases in staff FTE (gained 0.5 FTE or more). Almost half (46%) of IR offices showed decreases in staff FTE (lost 0.5 FTE or more), and 15% of IR offices had approximately the same staff FTEs.
As noted earlier, there is a correlation between IR office staff FTE and student enrollment FTE. Likewise, changes in IR office staff FTE also correlate with changes in student FTE enrollment, though the relationship is weaker.
Methodology
The 2018 AIR National Survey of IR Offices attempted to survey IR office leaders at more than 3,000 postsecondary degree-granting institutions. Institutions of all sectors, types of control, and sizes were included in the sample. In total, responses represented 1,167 institutions, and 566 of those institutions completed the survey in full. To ensure comparable results, incomplete responses are excluded from this report. In addition, responses from for-profit institutions, administrative units, international institutions, private not-for-profit 2-year institutions, and institutions in U.S. territories are excluded due to low response rates.
This Report
The findings presented in this report are based on 543 responses that represent U.S. postsecondary, degree-granting institutions at public 4-year, public 2-year, or private not-for-profit 4-year institutions.
1. Analytical staff are employees whose primary responsibilities are analyses and reporting. Technical staff are employees whose primary responsibilities are technical tasks, such as software programming and database management.
2. See methodology section at end of this report for more information.
Related Content
2018 AIR National Survey of IR Offices: Topic Briefs
