
Data Literacy, Capacity, and Maturity
This brief is one of a series of reports. Learn more at airweb.org/nationalsurvey.
Ideally, institutional stakeholders seek credible data to inform decision making for myriad reasons. For example, use of data helps overcome personal opinions and mitigate bias, identify equity gaps in student access and outcomes, and provide evidence of efficiencies and effectiveness, or lack thereof. But, to use data for decision making, stakeholders must be sufficiently data literate.
AIR defines data literacy as having the knowledge and skills to read, work with, analyze, and communicate with data. In addition, data literacy requires the proper knowledge, skills, mindsets, and habits to motivate other stakeholders to use data in decision making. If stakeholders have insufficient data literacy, they may base decisions on personal experiences which can be biased.
Data capacity is the ability of an institution to produce information for stakeholders’ decision making. But without sufficient data capacity, our IR offices and institutions cannot produce timely data and information in formats that are easily consumable by stakeholders.
In mature data environments, we can envision stakeholders who are sufficiently data literate to use data for their decision making appropriate for their roles and an institution that can produce timely information in consumable formats and make that information easily accessible.
In the 2021 AIR National Survey of IR Offices, we asked leaders to evaluate data literacy, capacity, and maturity within their institutions and IR offices.
Evaluation of Data Literacy Skills by Institutional Stakeholder Role
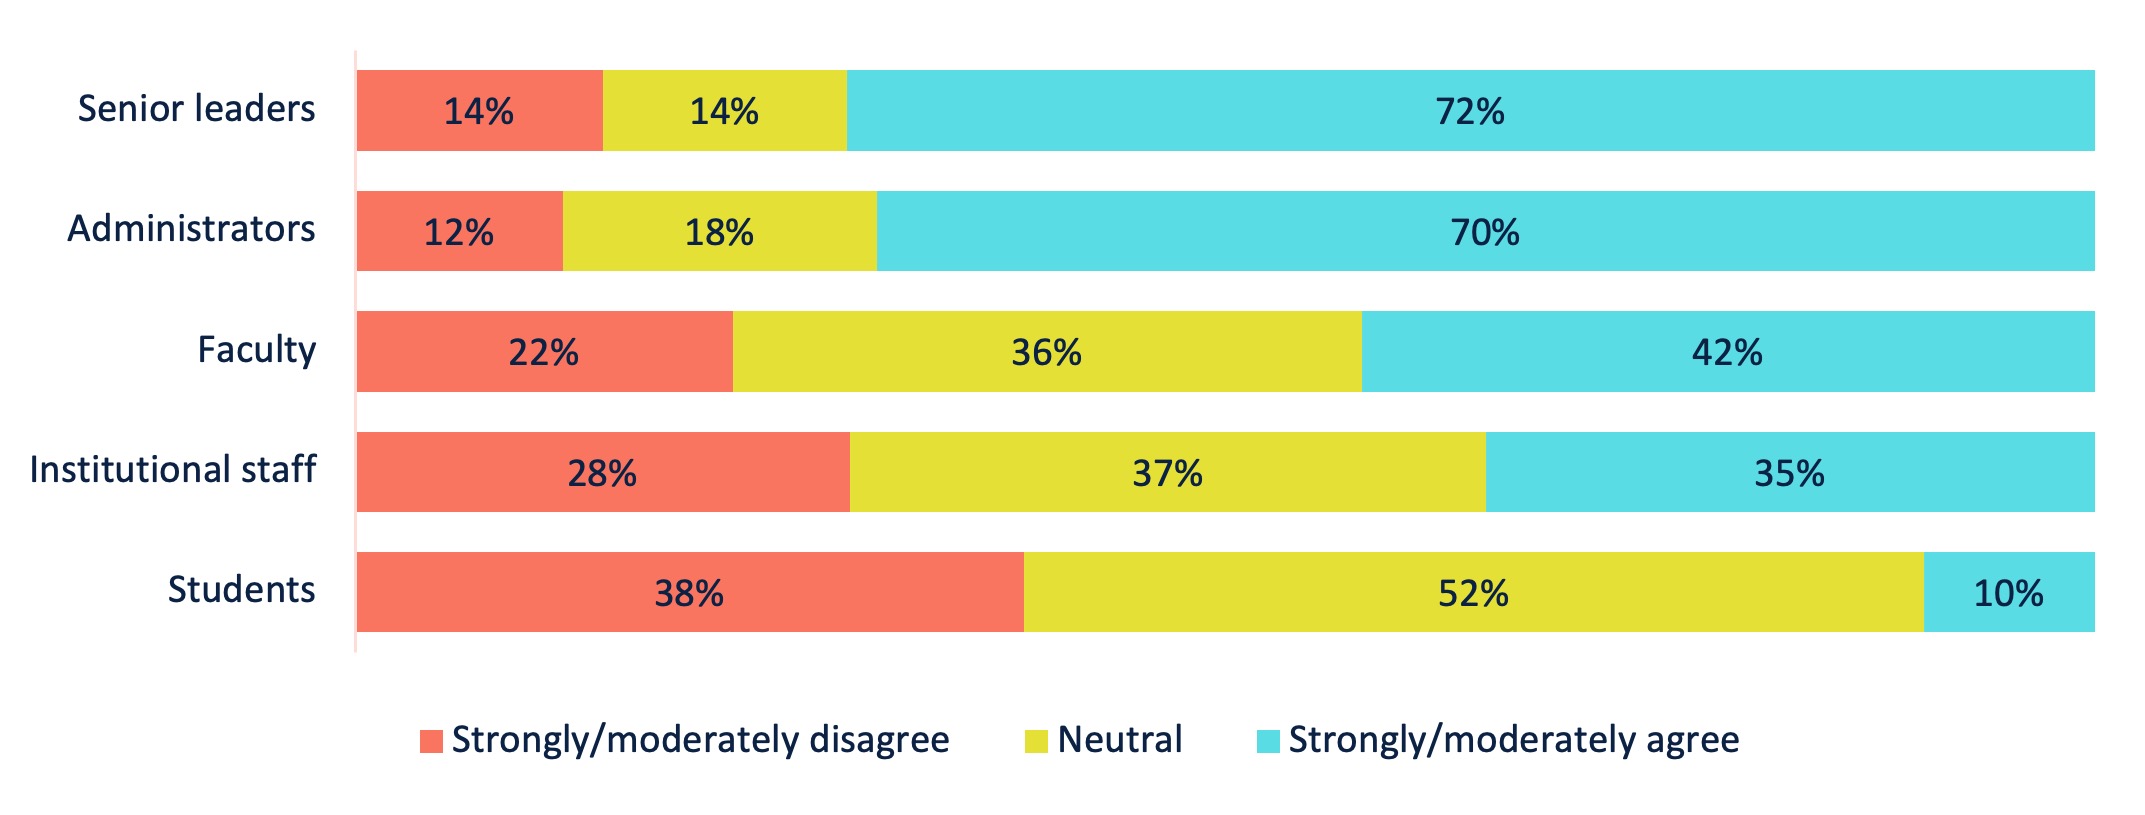
We asked IR office leaders to indicate their levels of agreement with the statement “stakeholders’ data literacy levels are high” on a 5-point Agree Likert-scale. Stakeholders refer to senior leaders, administrators, institutional staff, faculty, and students.
Approximately 70% of IR Office leaders agree that senior leaders and administrators have high data literacy, but far fewer agreed that other institutional stakeholders have high data literacy.
Chart 1. Office Leader Evaluation - Institutional Stakeholders' Data Literacy is High
The trend is consistent across major institutional sectors. Table 1 presents the percentages of IR office leaders who strongly agree or moderately agree for each institutional stakeholder role disaggregated by sector.
| Stakeholders | All Institutions | Public 4-year | Public 2-year | Private NFP 4-year |
|---|---|---|---|---|
| Senior leaders | 72% | 72% | 74% | 70% |
| Administrators | 70% | 71% | 72% | 68% |
| Faculty | 42% | 45% | 40% | 41% |
| Institutional staff | 35% | 34% | 31% | 37% |
| Students | 10% | 7% | 7% | 13% |
The leaders of 259 IR offices completed both the 2018 and 2021 AIR National Surveys and provided evaluations of institutional stakeholders’ data literacy skills. Comparing 2021 to 2018, we find that office leaders rate current data literacy skills at the same or lower than in 2018; this may be due to better understandings of data literacy and/or higher expectations for data literacy among colleagues (Table 2).
There are differences by sector; offices at public institutions rated data literacy skills lower in 2021 compared to 2018 while offices at private not-for-profit institutions rated data literacy skills higher except for faculty.
| All Institutions | Public 4-year | Public 2-year | Private NFP 4-year | |||||
|---|---|---|---|---|---|---|---|---|
| 2021 | 2018 | 2021 | 2018 | 2021 | 2018 | 2021 | 2018 | |
| Senior leaders | 73% | 73% | 69% | 76% | 78% | 78% | 75% | 68% |
| Administrators | 70% | 74% | 69% | 79% | 70% | 76% | 71% | 70% |
| Faculty | 38% | 43% | 39% | 46% | 35% | 37% | 39% | 43% |
| Institutional staff | 33% | 32% | 33% | 36% | 26% | 20% | 36% | 35% |
| Students | 9% | 8% | 3% | 6% | 11% | 7% | 13% | 11% |
Training to Improve Data Literacy Skills
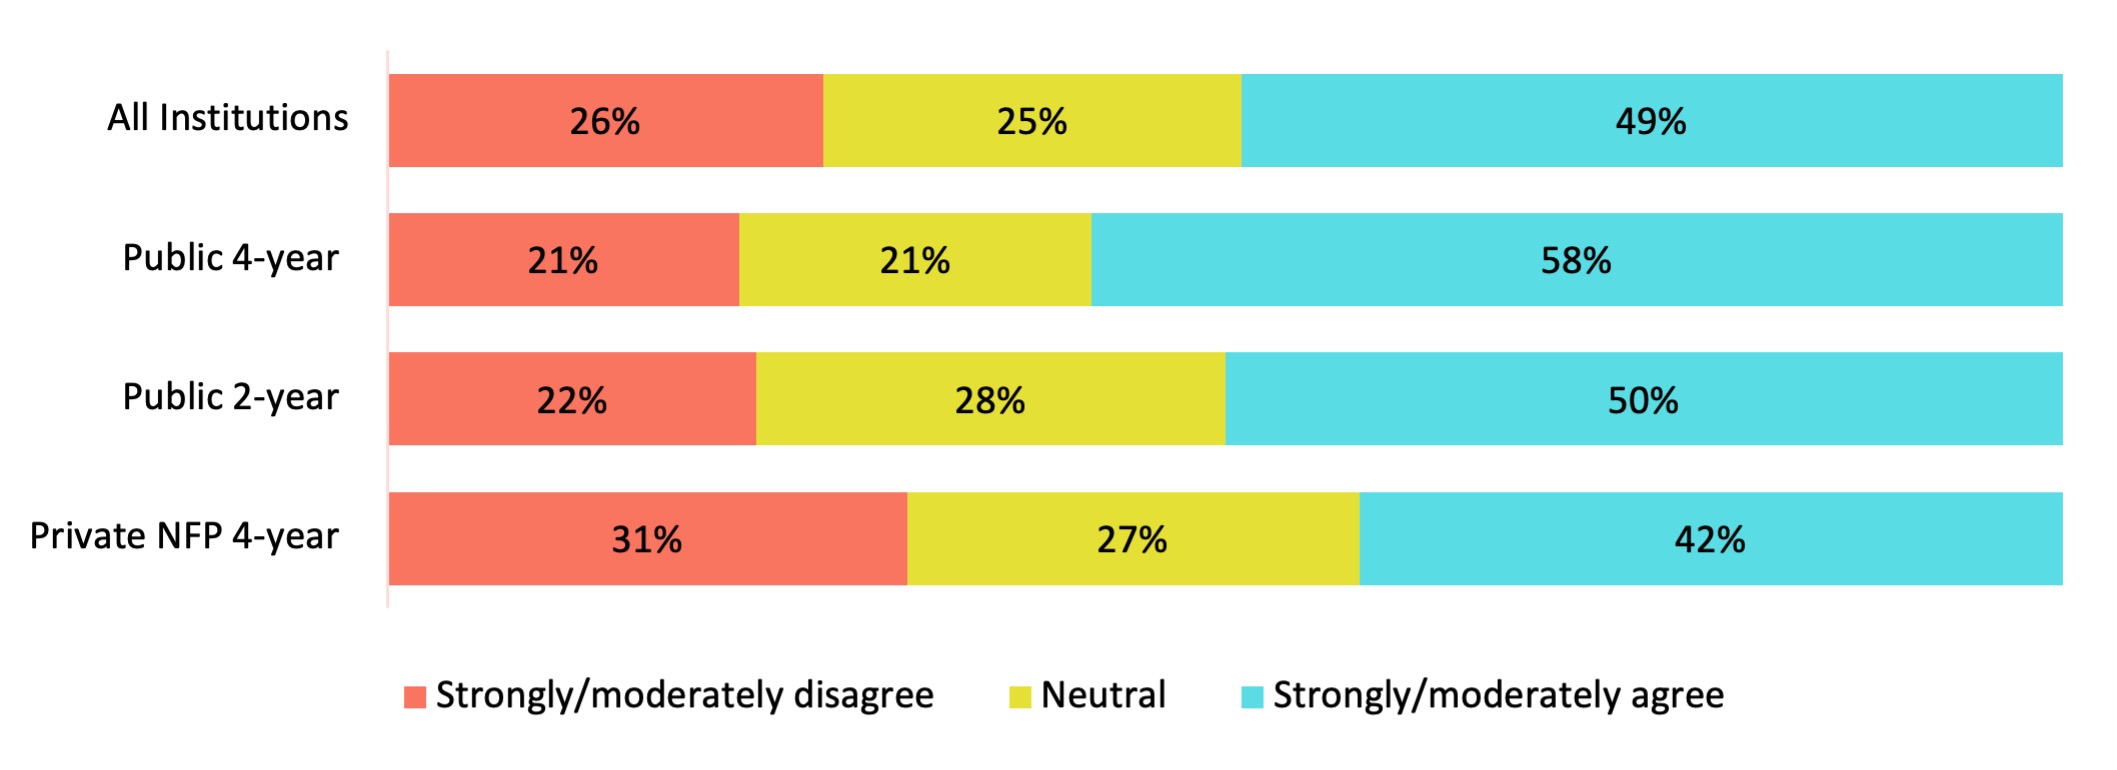
We asked IR office leaders to indicate their levels of agreement with the statement “office provides educational opportunities or coaching to enhance the data literacy of institutional stakeholders” on a 5-point Agree Likert scale. Nearly half of offices now provide some level of training to improve stakeholders’ data literacy skills (Chart 2); offices at public 4-year institutions are more likely to provide training compared to the other two sectors.
Chart 2. IR Office Provides Educational Opportunities to Enhance Data Literacy of Stakeholders
Data Capacity
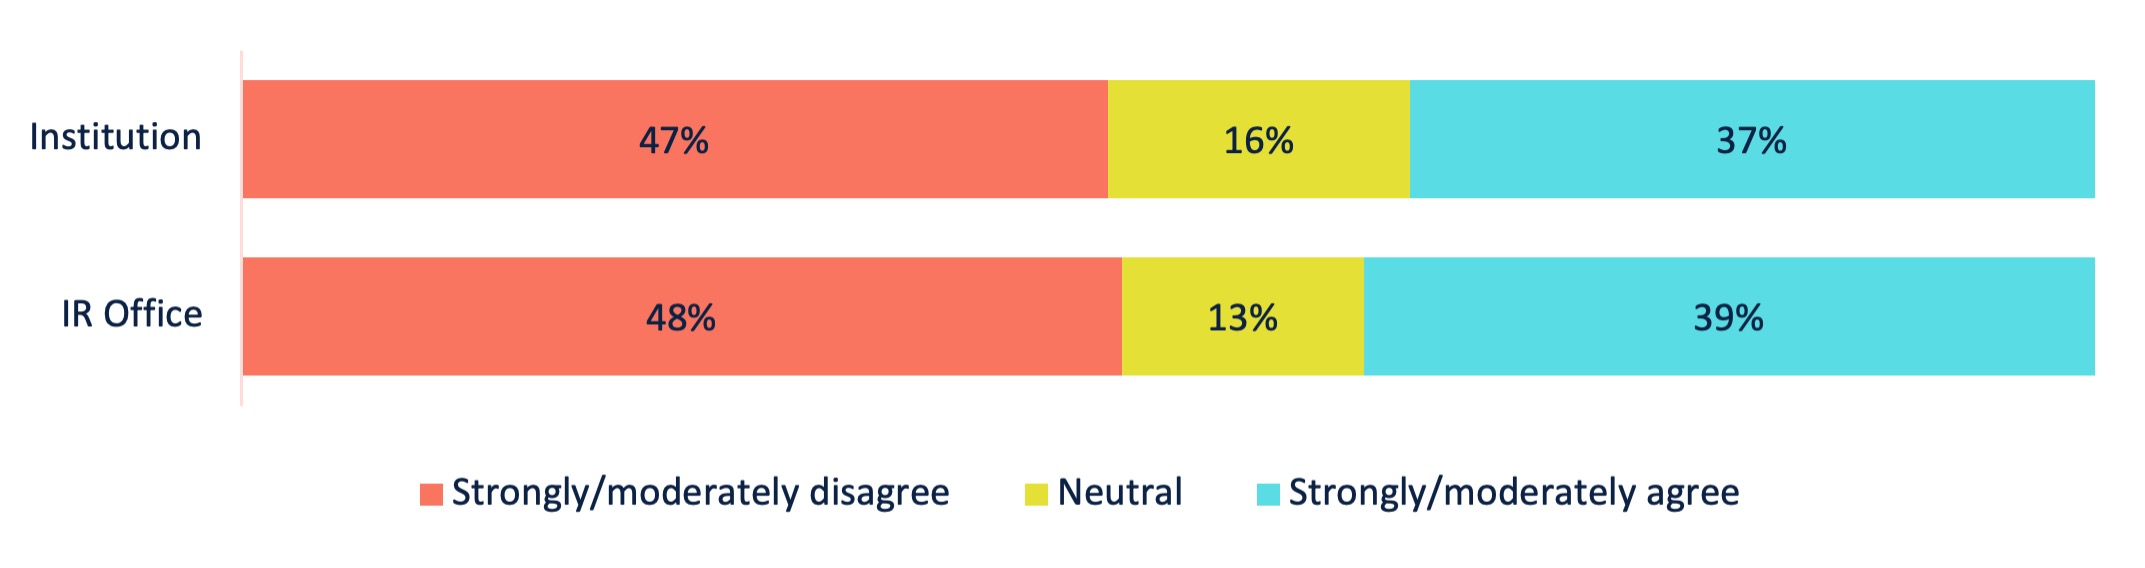
We asked IR office leaders to evaluate institutional and IR office data capacity by indicating their levels of agreement with the following two statements:
- Institution: There is sufficient capacity across the institution to meet stakeholders’ needs for data and information for decision making.
- IR Office: There is sufficient capacity within the IR office to meet stakeholders’ needs for data and information for decision making.
We found similar results for both questions. Approximately 37% of office leaders responded with “strongly agree” or “moderately agree” to these two questions whereas approximately 47% responded with “strongly disagree” or “moderately disagree”; the remaining were neutral (Chart 3). We also learned that data capacity (or lack of) in the institution strongly correlates with the data capacity (or lack of) within the IR Office (r = 0.793).
Chart 3. Evaluation of Data
The trend is consistent across major institutional sectors. Table 3 features the percentage of IR office leaders who responded strongly or moderately agree disaggregated by sector.
| All Institutions | Public 4-year | Public 2-year | Private NFP 4-year | |
|---|---|---|---|---|
| Institution | 37% | 38% | 39% | 35% |
| IR Office | 39% | 44% | 44% | 35% |
Among the 259 IR office leaders who completed both the 2018 and 2021 AIR National Surveys and provided evaluations of their institutions’ and offices’ data capacity, there was not a statistically significant difference in means between years for either survey question. This indicates there were no declines or improvements in data capacity during those three years.
IR Office Data Maturity
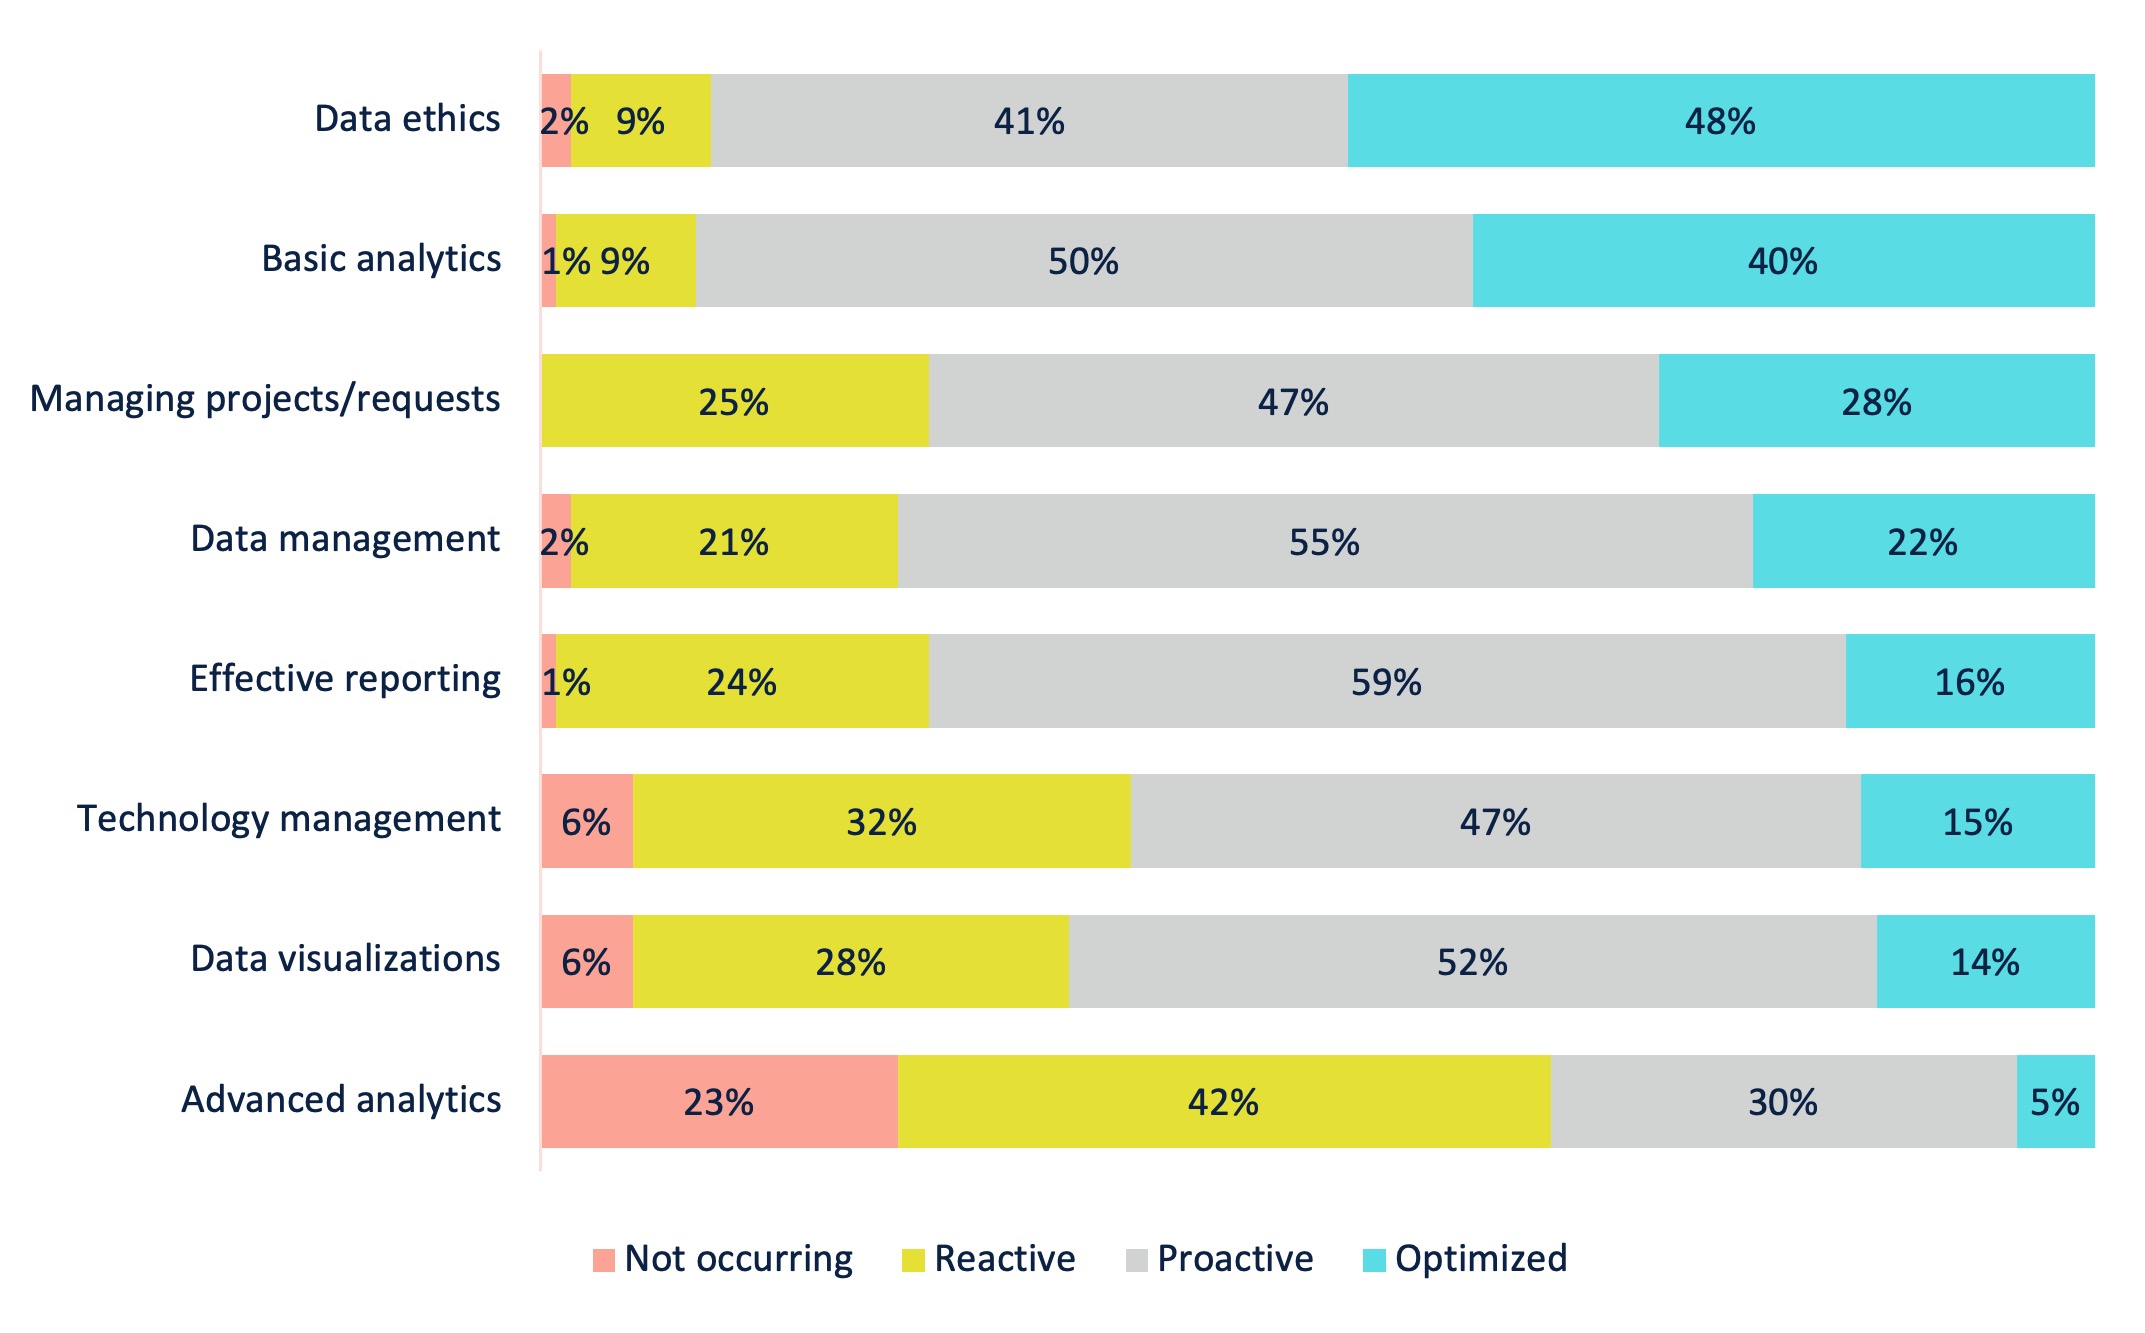
We asked office leaders to rate their offices’ data maturity on several metrics like data ethics and basic analytics. The 4-point rating scale was “not occurring”, “reactive”, “proactive”, and “optimized”. Approximately 90% of office leaders rate data ethics and their offices’ abilities to conduct basic analytics as proactive or optimized (Chart 4). However, far fewer rated their offices’ abilities to produce data visualizations and advanced analytics (e.g., predictive analytics, prescriptive analytics) as proactive or optimized.
Chart 4. IR Office Data Maturity
When these data are disaggregated by major institutional sector, we find some differences in the data maturity metrics (Table 4). For example, a higher percentage of offices at 4-year institutions reported proactive/optimized levels of basic analytics compared to 2-year institutions, while a higher percentage of offices at public sector institutions reported proactive/optimized levels of data visualizations compared to the private not-for-profit 4-year sector.
| All Institutions | Public 4-year | Public 2-year | Private NFP 4-year | |
|---|---|---|---|---|
| Basic analytics | 90% | 92% | 85% | 92% |
| Data ethics | 89% | 87% | 93% | 88% |
| Data management | 77% | 79% | 72% | 78% |
| Managing projects/requests | 75% | 79% | 74% | 73% |
| Effective reporting | 74% | 71% | 78% | 75% |
| Data visualizations | 66% | 75% | 69% | 59% |
| Technology management | 62% | 64% | 68% | 59% |
| Advanced analytics | 35% | 39% | 32% | 34% |
Institutional Data Maturity
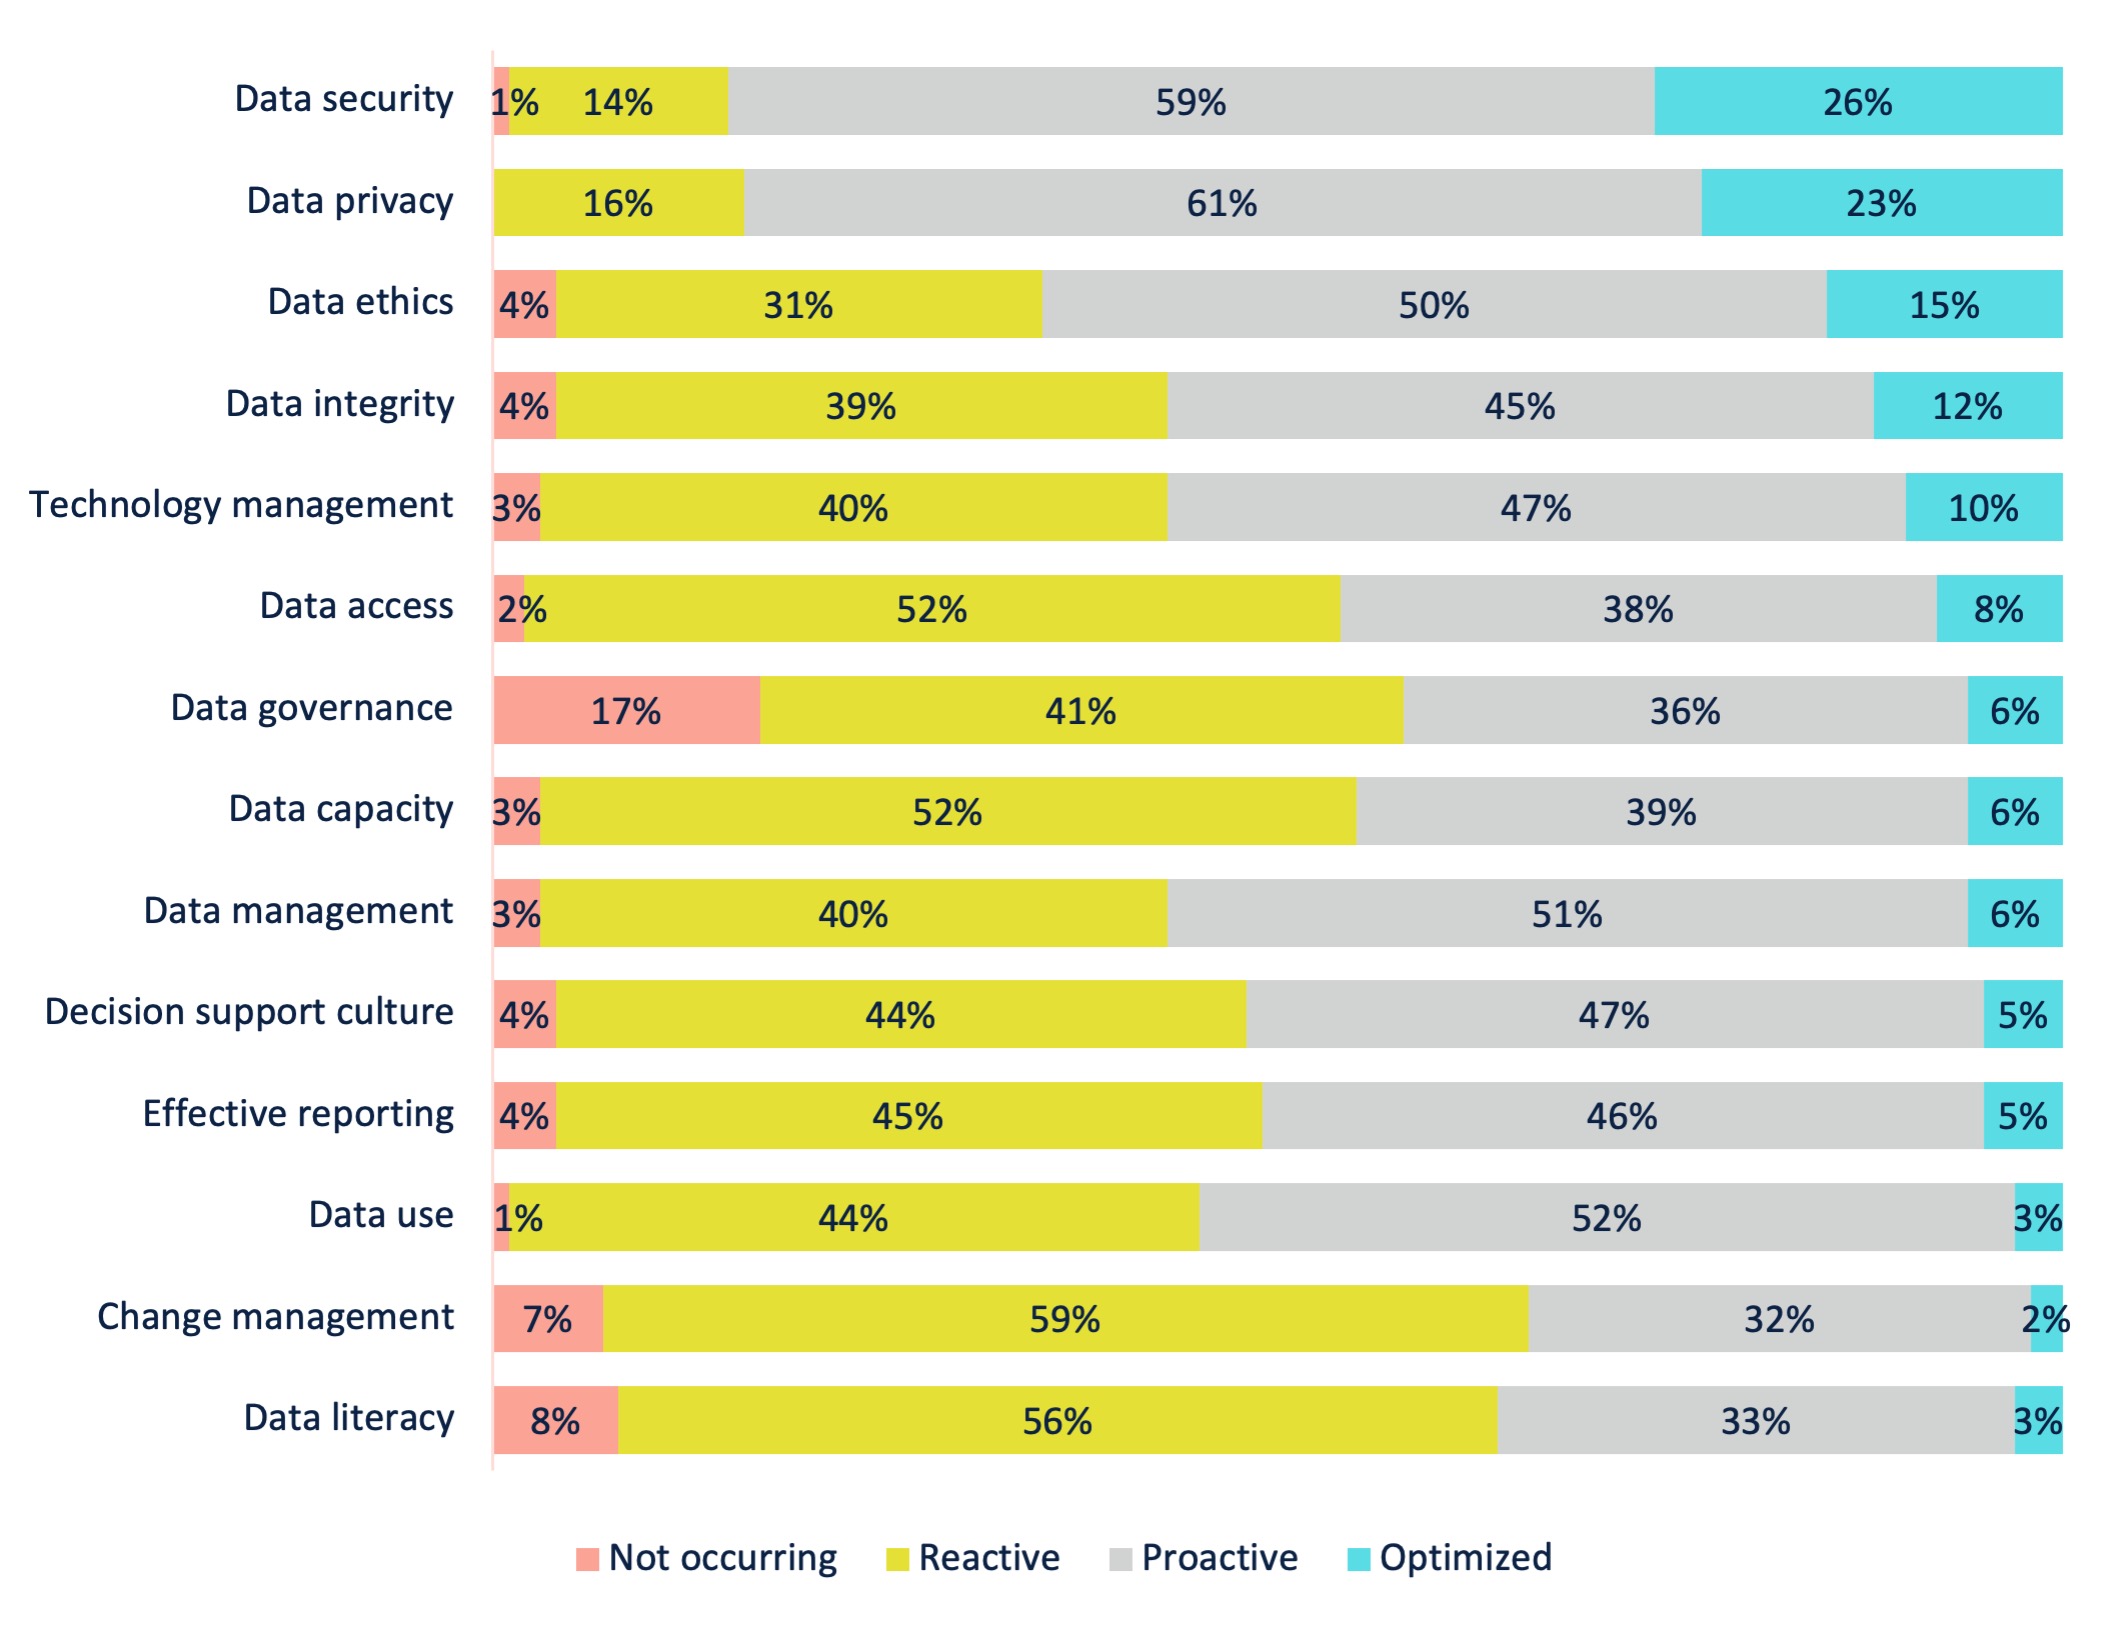
We asked office leaders to rate their institutions’ data maturity on a variety of metrics like data security and data privacy. The rating scale was “not occurring”, “reactive”, “proactive”, and “optimized”. Approximately 85% rated their institutions as proactive or optimized for data security and data privacy (Chart 5). However, far fewer rated their institutions as proactive or optimized in areas like data use, change management, or data literacy.
Chart 5. Institutional Data Maturity
When these results are disaggregated by major institutional sector, we find some differences depending on the data maturity metric (Table 5). For example, a higher percentage of offices at public institutions rated metrics like data access and data capacity at the proactive or optimized level compared to offices at private not-for-profit 4-year institutions.
| All Institutions | Public 4-year | Public 2-year | Private NFP 4-year | |
|---|---|---|---|---|
| Data security | 85% | 87% | 87% | 83% |
| Data privacy | 84% | 82% | 85% | 83% |
| Data ethics | 65% | 65% | 69% | 64% |
| Data management | 57% | 60% | 61% | 54% |
| Technology management | 57% | 60% | 64% | 53% |
| Data integrity | 57% | 57% | 57% | 56% |
| Data use | 55% | 59% | 60% | 52% |
| Decision support culture | 52% | 53% | 61% | 47% |
| Effective reporting | 51% | 51% | 61% | 45% |
| Data access | 46% | 52% | 61% | 35% |
| Data capacity | 45% | 50% | 55% | 38% |
| Data governance | 42% | 41% | 44% | 42% |
| Data literacy | 36% | 38% | 43% | 30% |
| Change management | 34% | 37% | 37% | 32% |
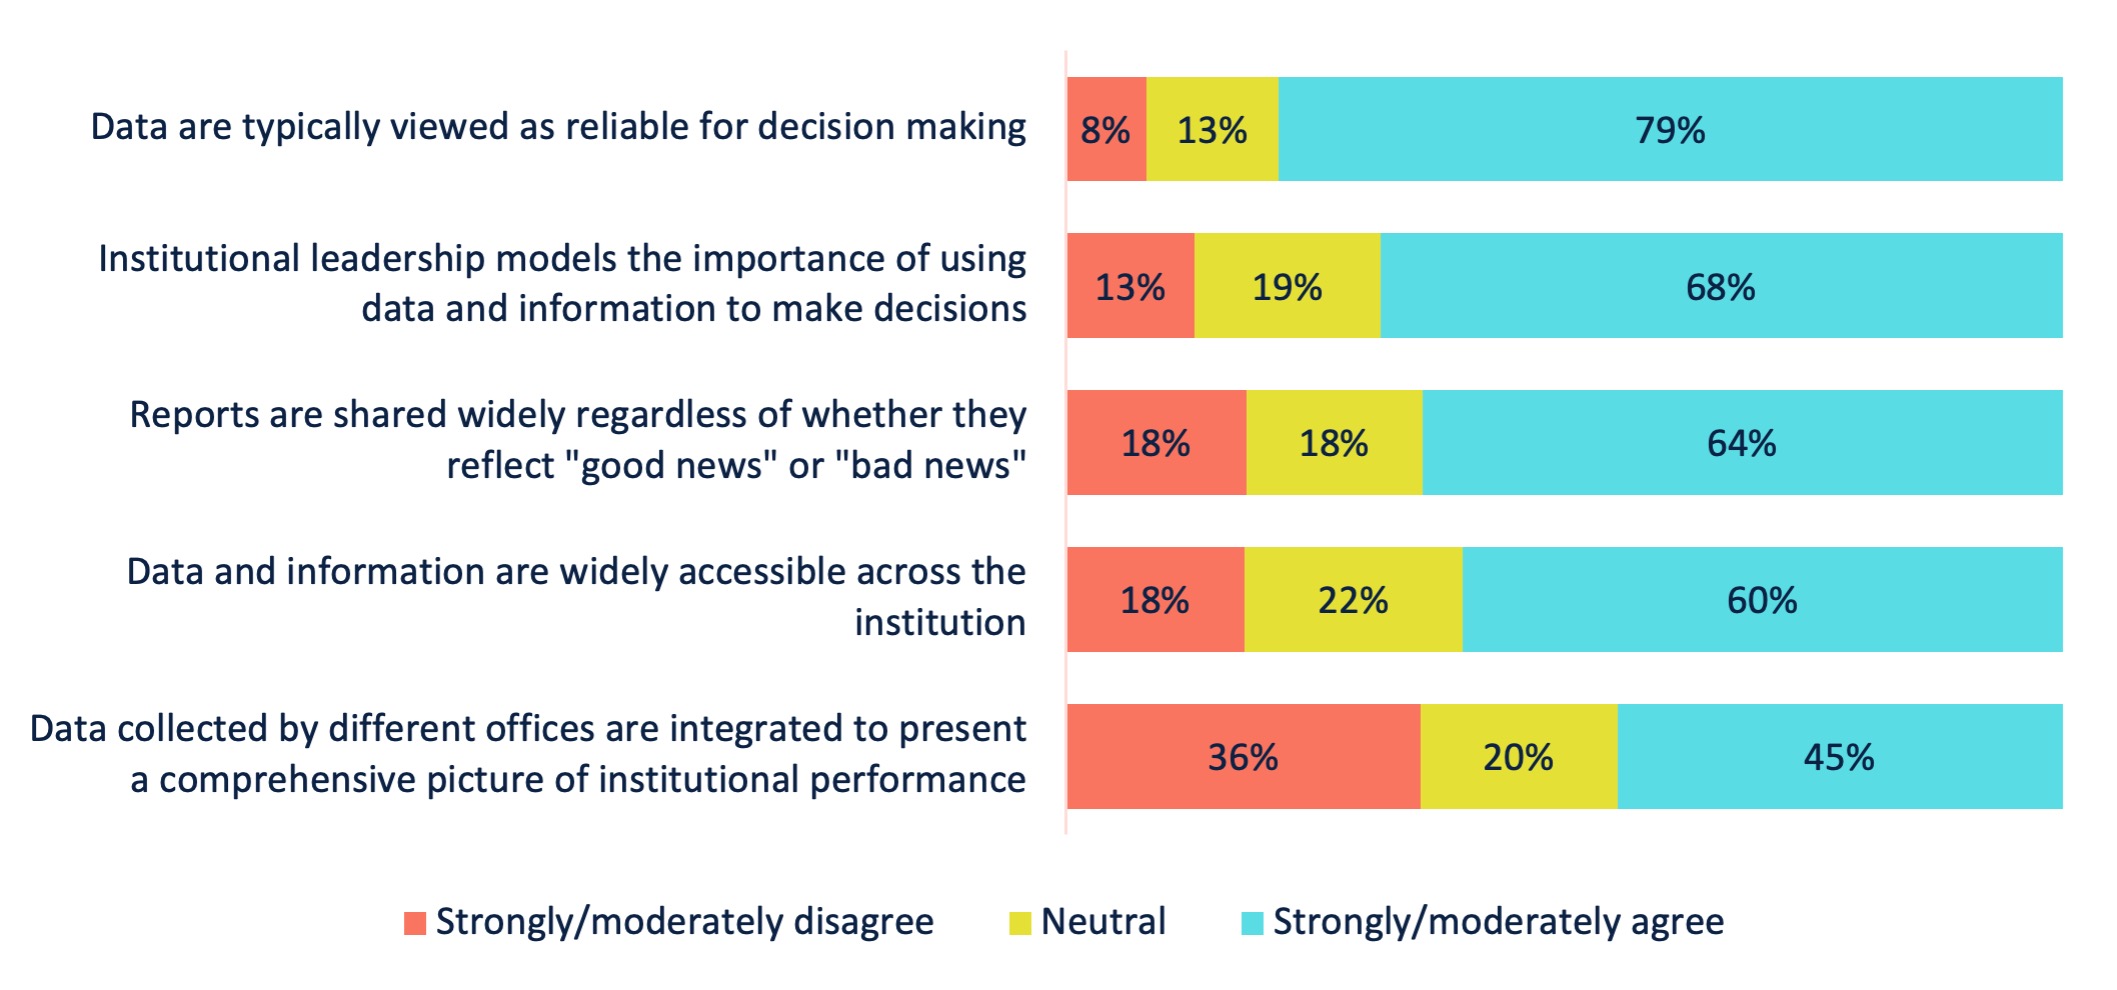
We also asked office leaders to rate their institutions on a series of items related to the data environment; that rating used a 5-point Likert Agreement scale (Chart 6). We found that 79% of office leaders agree that data are typically viewed as reliable for decision making whereas only 45% said that data collected by different offices are integrated for reporting.
Chart 6. Rating of Institutional Data Environment
Disaggregating by major institutional sector, we find some differences. For example, a higher percentage of office leaders at public institutions agree that their institutional leaders model data-informed decision making, and that data are widely accessible across the institution compared to private not-for-profit 4-year institutions (Table 6).
| All Institutions | Public 4-year | Public 2-year | Private NFP 4-year | |
|---|---|---|---|---|
| Data are typically viewed as reliable for decision making | 79% | 82% | 78% | 77% |
| Institutional leadership models the importance of using data and information to make decisions | 68% | 73% | 76% | 62% |
| Reports are shared widely regardless of whether they reflect "good news" or "bad news" | 64% | 68% | 76% | 56% |
| Data and information are widely accessible across the institution | 60% | 73% | 73% | 47% |
| Data collected by different offices are integrated to present a comprehensive picture of institutional performance | 45% | 42% | 46% | 45% |
IR Office Data Maturity vs. Institutional Data Maturity
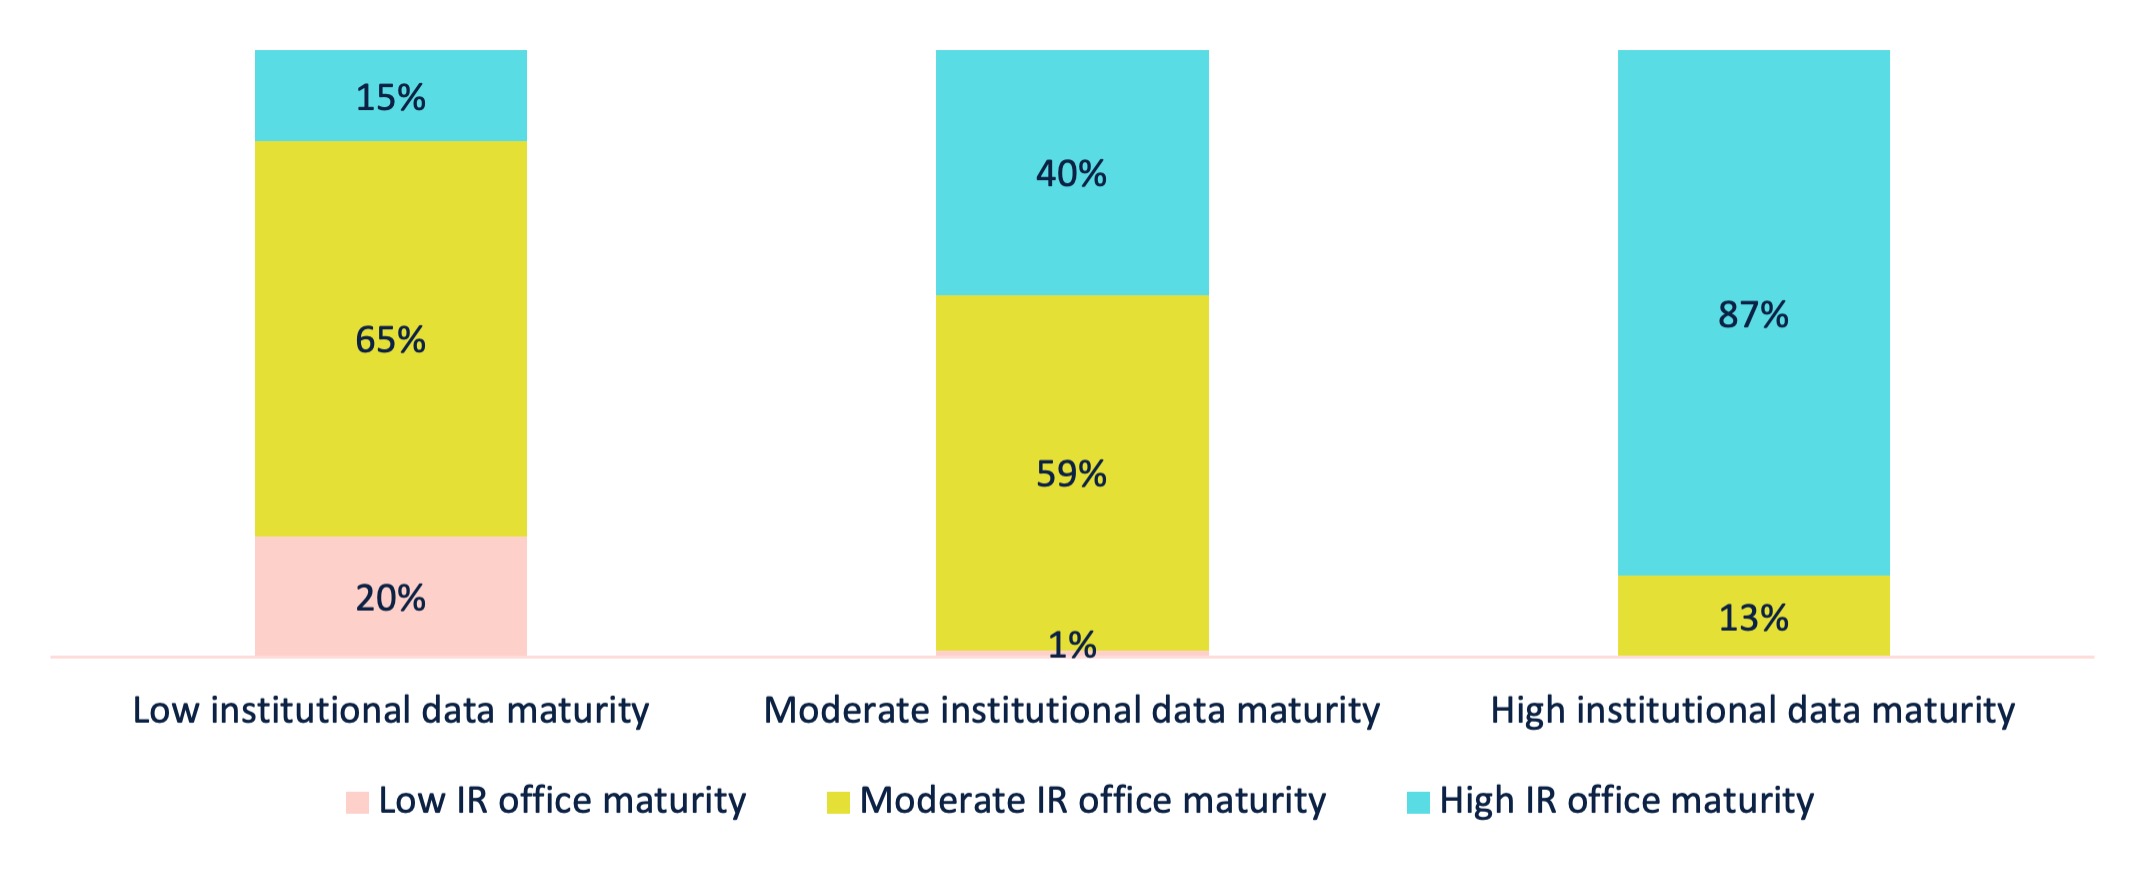
The leaders of IR offices at 382 institutions provided ratings of data maturity at their offices and institutions. For those institutions, we calculated overall data maturity values. Using those values, we found that the institutional data maturity ratings correlated with IR office data maturity ratings (r = 0.580). This indicates that, if an institution has stronger (or weaker) levels of data maturity, the IR Office is also likely to have stronger (or weaker) data maturity.
We illustrate this effect in Chart 7. Of the institutions rated as having low data maturity, 85% of the corresponding IR offices are rated as having low or moderate data maturity. However, among those institutions that are rated high on data maturity, 87% of the corresponding IR offices are also rated as having high data maturity.
Chart 7. Relationship between Institutional and IR Office Data Maturity
While institutional enrollment is a factor that impacts IR office staff size and office leader salaries (i.e., institutions with larger student enrollments also have larger IR offices and higher office leader salaries), we did not find a similar correlation between institutional enrollment and institutional or IR office data maturity. In other words, we found examples of mature data environments at both small and large institutions.
Resources
Association for Institutional Research. (2022). Data literacy institute [course]. Author. www.airweb.org
Morrow, J. (2021). Be Data Literate: The Data Literacy Skills Everyone Needs to Succeed. Kogan Page Limited.
Jones, D., Keller, C., & Raza, Z. (2022). 2021 AIR National Survey of IR Offices: IR Office Staff Roles [Report]. Association for Institutional Research. www.airweb.org/NationalSurvey.
Jones, D., Keller, C., & Raza, Z. (2022). 2021 AIR National Survey of IR Offices: IR Office Full-time Staff Salaries [Report]. Association for Institutional Research. www.airweb.org/NationalSurvey.
Methodology
The 2021 AIR National Survey of IR Offices attempted to survey IR office leaders at more than 3,000 postsecondary degree-granting institutions. Institutions of all sectors, types of control, and sizes were included in the sample. In total, responses were collected from 1,142 institutions, and 554 of those institutions completed the survey in full. To ensure comparable results, incomplete responses are excluded from this report. In addition, responses from for-profit institutions, administrative units, international institutions, private not-for-profit 2-year institutions, and institutions in U.S. territories are excluded due to low response rates.
The findings presented in this report are based on 520 responses that represent U.S. postsecondary, degree-granting institutions at public 4-year (146 institutions), public 2-year (125 institutions), or private not-for-profit 4-year institutions (249 institutions).
Suggested Citation
Jones, D. & Keller, C. (2022). 2021 AIR National Survey of IR Offices: Data Literacy, Capacity, and Maturity [Report]. Association for Institutional Research. www.airweb.org/NationalSurvey.
Related Content
2021 AIR National Survey of IR Offices: Topic Briefs
AIR National Survey of IR Offices
Long Description
Chart 1. Office Leader Evaluation - Institutional Stakeholders' Data Literacy is High
Chart 1 is a bar chart. Numerical values presented on the image:
| Stakeholder | Strongly/moderately disagree | Neutral | Strongly/moderately agree |
|---|---|---|---|
| Students | 38% | 52% | 10% |
| Institutional staff | 28% | 37% | 35% |
| Faculty | 22% | 36% | 42% |
| Administrators | 12% | 18% | 70% |
| Senior leaders | 14% | 14% | 72% |
Chart 2. IR Office Provides Educational Opportunities to Enhance Data Literacy of Stakeholders
Chart 2 is a bar chart. Numerical values presented on the image:
| Institution Type | Strongly/moderately disagree | Neutral | Strongly/moderately agree |
|---|---|---|---|
| Private NFP 4-year | 31% | 27% | 42% |
| Public 2-year | 22% | 28% | 50% |
| Public 4-year | 21% | 21% | 58% |
| All Institutions | 26% | 25% | 49% |
Chart 3. Evaluation of Data Capacity
Chart 3 is a bar chart. Numerical values presented on the image:
| Scope | Strongly/moderately disagree | Neutral | Strongly/moderately agree |
|---|---|---|---|
| IR Office | 48% | 13% | 39% |
| Institution | 47% | 16% | 37% |
Chart 4. IR Office Data Maturity
Chart 4 is a bar chart. Numerical values presented on the image:
| Area | Not occurring | Reactive | Proactive | Optimized |
|---|---|---|---|---|
| Advanced analytics | 23% | 42% | 30% | 5% |
| Data visualizations | 6% | 28% | 52% | 14% |
| Technology management | 6% | 32% | 47% | 15% |
| Effective reporting | 1% | 24% | 59% | 16% |
| Data management | 2% | 21% | 55% | 22% |
| Managing projects/requests | 0% | 25% | 47% | 28% |
| Basic analytics | 1% | 9% | 50% | 40% |
| Data ethics | 2% | 9% | 41% | 48% |
Chart 5. Institutional Data Maturity
Chart 5 is a bar chart. Numerical values presented on the image:
| Area | Not occurring | Reactive | Proactive | Optimized |
|---|---|---|---|---|
| Data literacy | 8% | 56% | 33% | 3% |
| Change management | 7% | 59% | 32% | 2% |
| Data use | 1% | 44% | 52% | 3% |
| Effective reporting | 4% | 45% | 46% | 5% |
| Decision support culture | 4% | 44% | 47% | 5% |
| Data management | 3% | 40% | 51% | 6% |
| Data capacity | 3% | 52% | 39% | 6% |
| Data governance | 17% | 41% | 36% | 6% |
| Data access | 2% | 52% | 38% | 8% |
| Technology management | 3% | 40% | 47% | 10% |
| Data integrity | 4% | 39% | 45% | 12% |
| Data ethics | 4% | 31% | 50% | 15% |
| Data privacy | 0% | 16% | 61% | 23% |
| Data security | 1% | 14% | 59% | 26% |
Chart 6. Rating of Institutional Data Environment
Chart 6 is a bar chart. Numerical values presented on the image:
| Statement | Strongly/moderately disagree | Neutral | Strongly/moderately agree |
|---|---|---|---|
| Data collected by different offices are integrated to present a comprehensive picture of institutional performance | 36% | 20% | 45% |
| Data and information are widely accessible across the institution | 18% | 22% | 60% |
| Reports are shared widely regardless of whether they reflect "good news" or "bad news" | 18% | 18% | 64% |
| Institutional leadership models the importance of using data and information to make decisions | 13% | 19% | 68% |
| Data are typically viewed as reliable for decision making | 8% | 13% | 79% |
Chart 7. Relationship between Institutional and IR Office Data Maturity
Chart 7 is a bar chart. Numerical values presented on the image:
| Maturity Level | Low institutional data maturity | Moderate institutional data maturity | High institutional data maturity |
|---|---|---|---|
| Low IR office maturity | 20% | 1% | 0% |
| Moderate IR office maturity | 65% | 59% | 13% |
| High IR office maturity | 15% | 40% | 87% |