
IR Office Reporting Relationships
This brief is one of a series of reports. Learn more at airweb.org/nationalsurvey.
Organizational structure identifies official reporting relationships and ideally indicates the ways information moves through the institution. Knowledge of the institutional research (IR) office’s position within the hierarchy can shed light on the role it plays in achievement of the institution’s mission, the influence and role of the IR office leader in relation to senior executives, and the portfolio of work within the leader’s purview. The 2021 AIR National Survey of IR Offices sought to explore these relationships to help illuminate our understanding of the work of IR.
Current Reporting Relationships
In the 2021 National Survey, we asked office leaders to identify their current reporting lines. Of the 520 institutions that answered this question, most IR office leaders (84%) report to one of three units. Specifically, 58% report to the provost/chief academic officer (CAO), 18% report to the president/chief executive officer (CEO), and 8% report to an independent IR/institutional effectiveness (IE)/planning unit.
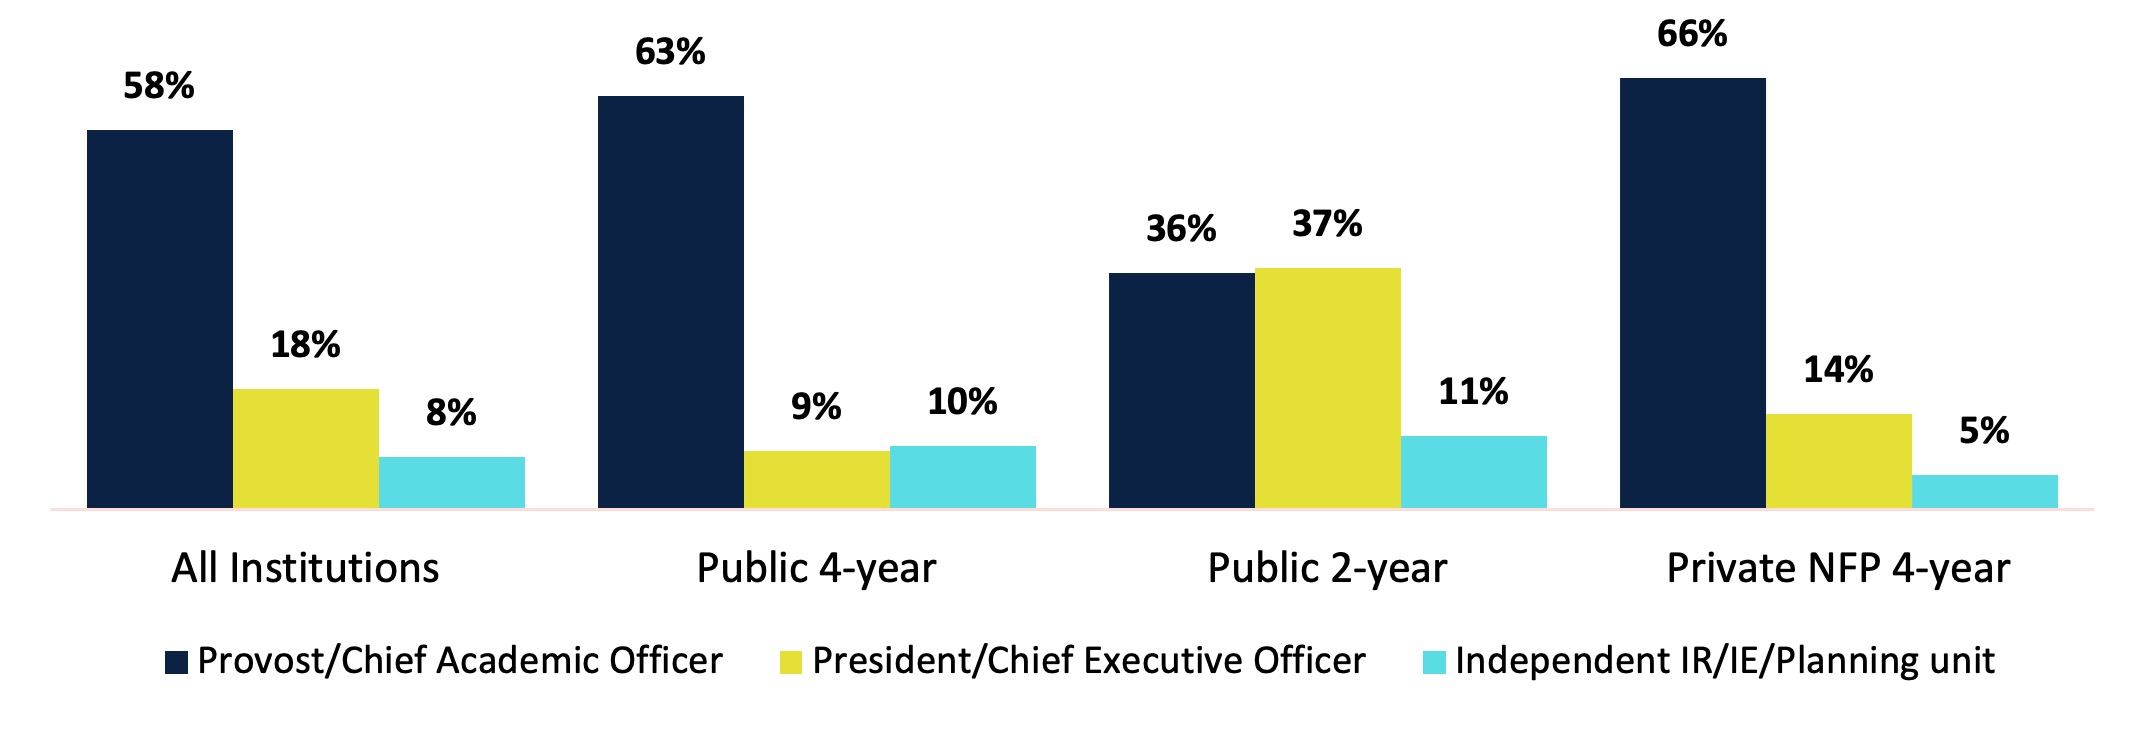
However, there is a significant difference in reporting relationships by major institutional sector: public 4-year, public 2-year, and private not-for-profit 4-year (Chart 1). Over 60% of IR offices in public 4-year institutions and private not-for-profit 4-year institutions report to the provost while only 36% of IR offices at public 2-year institutions report to that office. However, 37% of offices at public 2-year institutions report to the president compared to 9% and 14% at public 4-year and private not-for-profit 4-year institutions, respectively.
Chart 1. Current IR Office Reporting Relationship
The remaining IR offices report to other units, such as finance, information technology (IT), and enrollment management (Table 1).
| All Institutions | Public 4-year | Public 2-year | Private NFP 4-year | |
|---|---|---|---|---|
| Provost/Chief Academic Officer | 58% | 63% | 36% | 66% |
| President/Chief Executive Officer | 18% | 9% | 37% | 14% |
| Independent IR/IE/Planning Division | 8% | 10% | 11% | 5% |
| Finance/Operations/Business | 5% | 9% | 2% | 5% |
| Information Technology (IT) | 4% | 5% | 3% | 4% |
| Enrollment Management/Admissions | 3% | 2% | 1% | 4% |
| Administration Services | 1% | 1% | 2% | 0% |
| Other | 3% | 1% | 8% | 1% |
Longitudinal Changes in Reporting Relationships
Reporting relationships often shift over time, especially when an institution undergoes significant change (e.g., new leadership, new strategic plan) or implements a new reporting structure to improve operational efficiency.
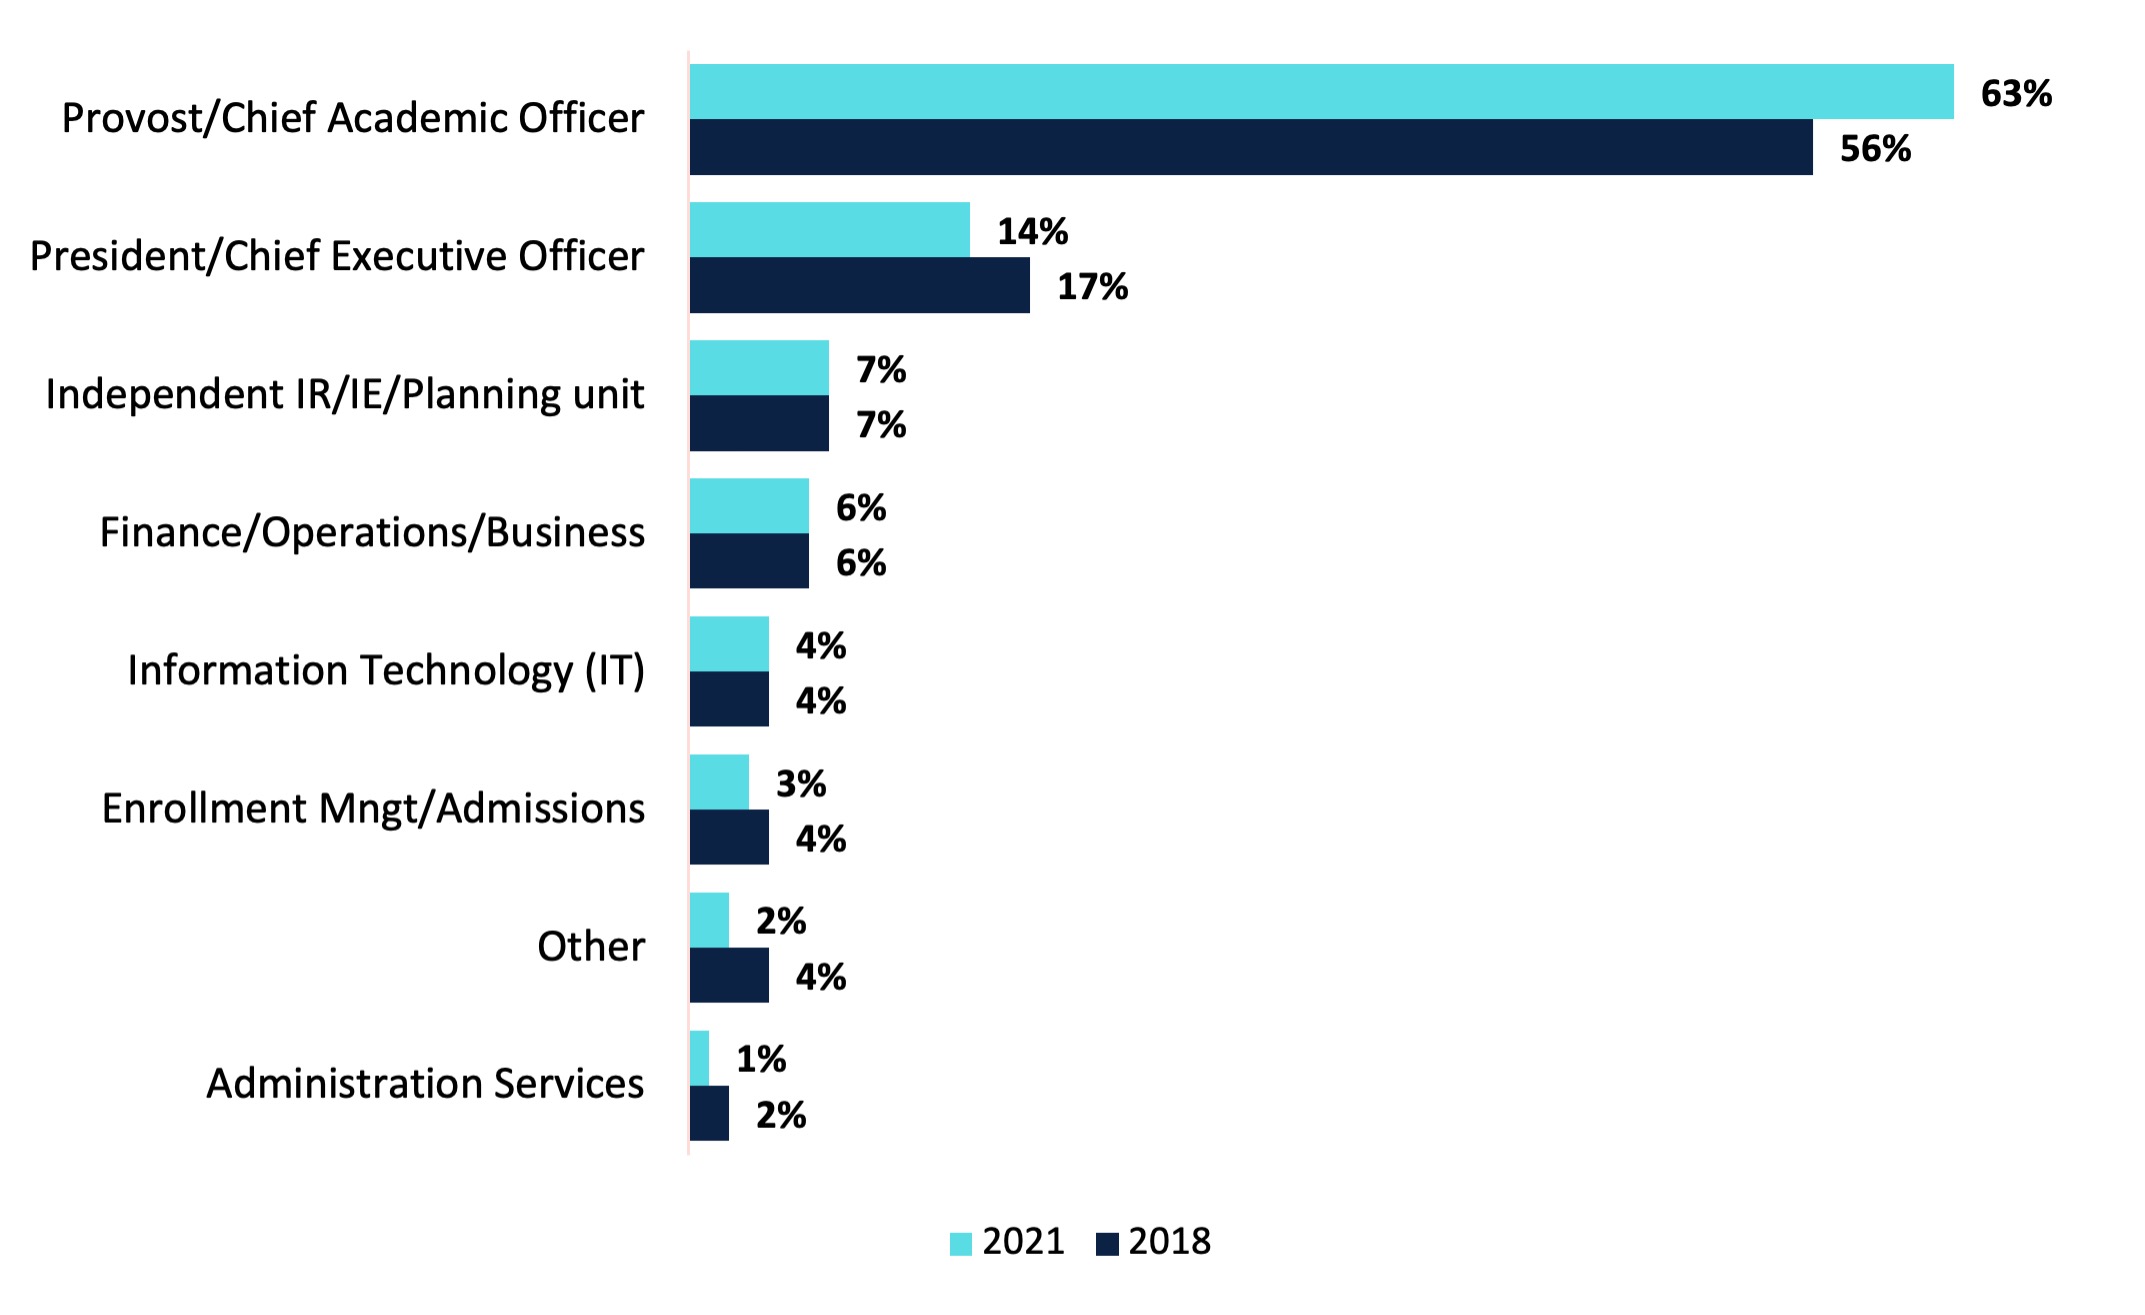
There were 259 IR offices who responded to both the 2018 and 2021 AIR National Surveys and provided information on their reporting relationships. Overall, a higher percentage of IR offices reported to the provost in 2021 compared to 2018, whereas fewer IR offices reported to the president in 2021 compared to 2018 (Chart 2).
Chart 2. Changes to Reporting Relationships: 2021 vs. 2018
Changes within major institutional sectors illuminate a more nuanced story. IR offices at public 4-year institutions saw small changes in their reporting relationships between 2018 and 2021 whereas considerably more offices at public 2-year and private not-for-profit institutions 4-year institutions reported to the provost in 2021 compared to 2018 (an increase of 13 and 11 percentage points, respectively); see Table 2.
| Reporting Relationship | All Institutions | Public 4-year | Public 2-year | Private NFP 4-year | ||||
|---|---|---|---|---|---|---|---|---|
| 2021 | 2018 | 2021 | 2018 | 2021 | 2018 | 2021 | 2018 | |
| Provost/Chief Academic Officer | 63% | 56% | 64% | 65% | 43% | 30% | 69% | 58% |
| President/Chief Executive Officer | 14% | 17% | 8% | 11% | 30% | 37% | 13% | 13% |
| Independent IR/IE/Planning unit | 7% | 7% | 10% | 7% | 9% | 15% | 3% | 5% |
| Finance/Operations/Business | 6% | 6% | 7% | 6% | 4% | 7% | 6% | 6% |
| Information Technology (IT) | 4% | 4% | 4% | 4% | 2% | 2% | 4% | 4% |
| Enrollment Mngt/Admissions | 3% | 4% | 3% | 1% | 0% | 0% | 5% | 7% |
| Administration Services | 1% | 2% | 2% | 2% | 2% | 2% | 0% | 2% |
| Other | 2% | 4% | 2% | 4% | 10% | 7% | 0% | 5% |
Ideal Reporting Relationships
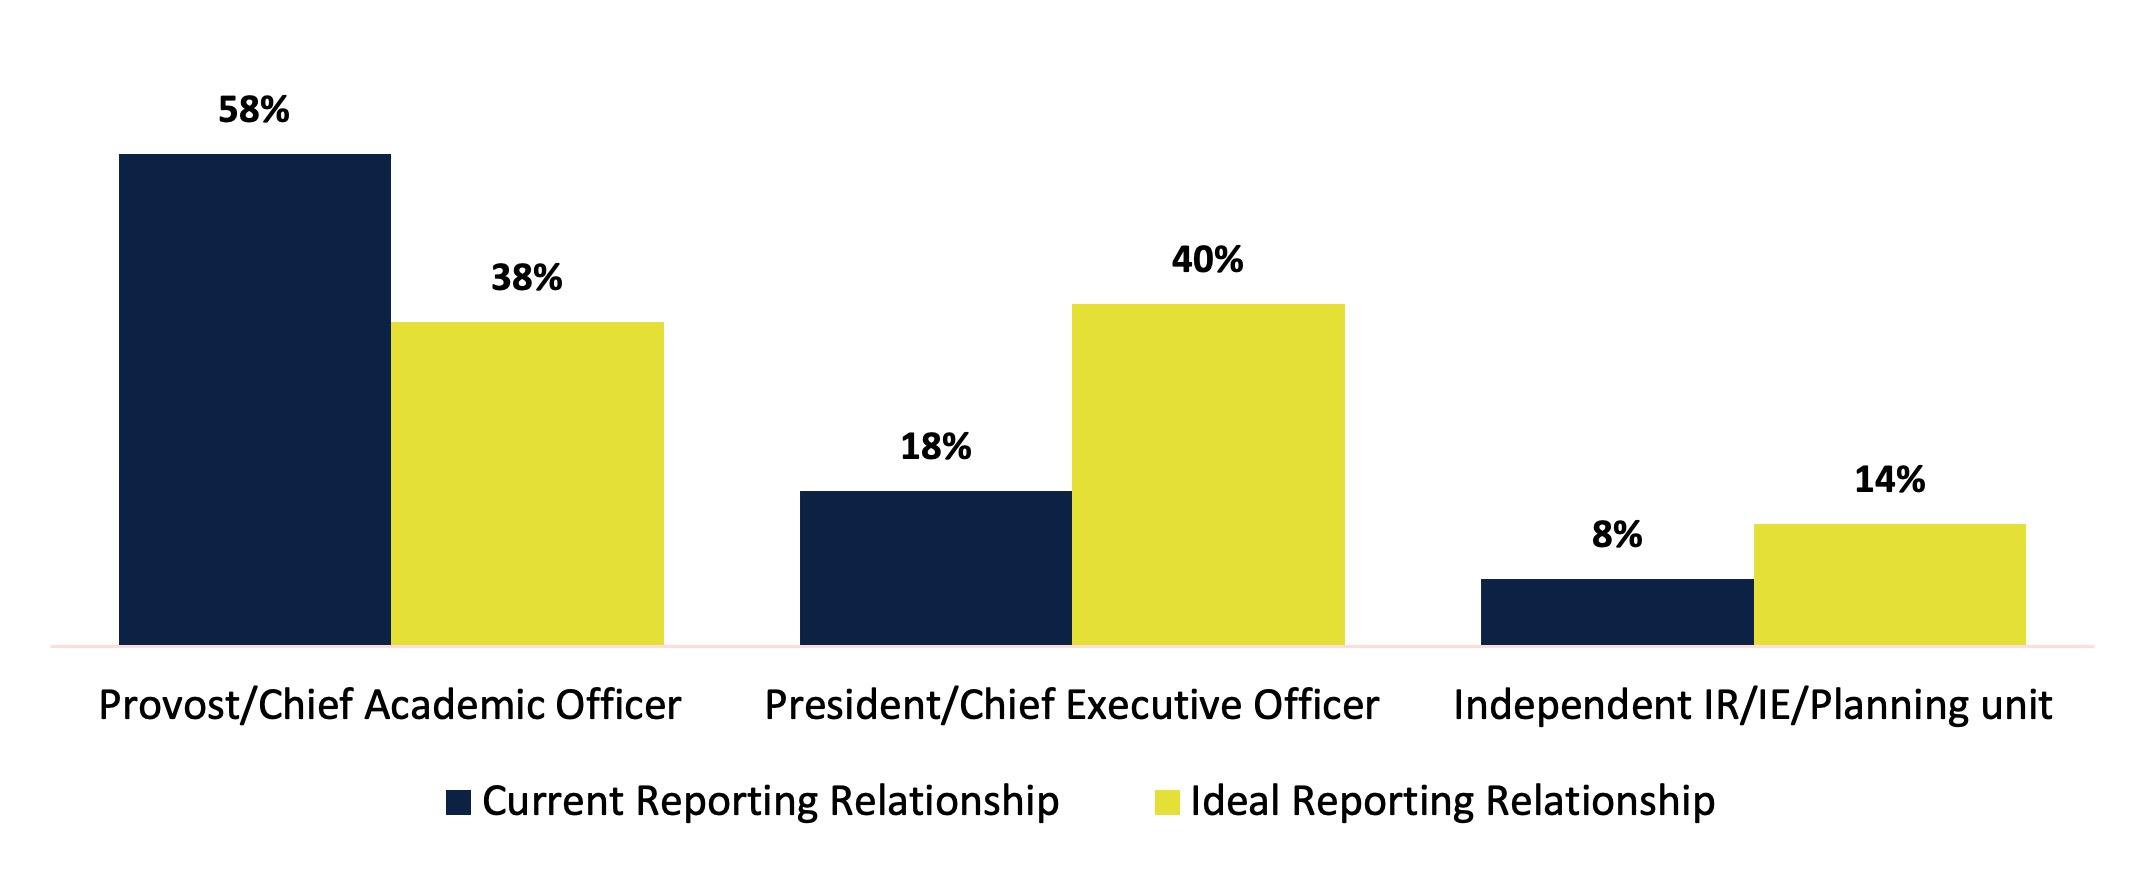
Reporting lines do not always match IR office leaders’ preferences. We found that over one-third (36%) of IR office leaders do not report to divisions they deem ideal. Of the institutions represented in the survey, 93% of IR office leaders indicated that the ideal would be to report to the president, provost, or independent IR/IE/planning unit (Chart 3).
Comparing the current reporting relationship with the ideal relationship, we find that while 58% of office leaders report to the provost, only 38% prefer to. And while 18% of office leaders report to the president, that is the preferred reporting relationship for 40% of the offices.
Chart 3. Current vs. Ideal Reporting Relationship
This pattern holds true when the data are disaggregated by institutional sector. Except for public 4-year institutions, more IR office leaders say they would ideally report to the institution’s president and fewer prefer to report to the provost.
| Reporting Relationship | All Institutions | Public 4-year | Public 2-year | Private NFP 4-year | ||||
|---|---|---|---|---|---|---|---|---|
| Current | Ideal | Current | Ideal | Current | Ideal | Current | Ideal | |
| President/Chief Executive Officer | 18% | 40% | 9% | 34% | 37% | 56% | 14% | 36% |
| Provost/Chief Academic Officer | 58% | 38% | 63% | 41% | 36% | 18% | 66% | 46% |
| Independent IR/IE/Planning unit | 8% | 14% | 10% | 14% | 11% | 19% | 5% | 12% |
Methodology
The 2021 AIR National Survey of IR Offices attempted to survey IR office leaders at more than 3,000 postsecondary degree-granting institutions. Institutions of all sectors, types of control, and sizes were included in the sample. In total, responses were collected from 1,142 institutions, and 554 of those institutions completed the survey in full. To ensure comparable results, incomplete responses are excluded from this report. In addition, responses from for-profit institutions, administrative units, international institutions, private not-for-profit 2-year institutions, and institutions in U.S. territories are excluded due to low response rates.
The findings presented in this report are based on 520 responses that represent U.S. postsecondary, degree-granting institutions at public 4-year (146 institutions), public 2-year (125 institutions), or private not-for-profit 4-year institutions (249 institutions).
Suggested Citation
Jones, D., Keller, C., & Raza, Z., (2022). 2021 AIR National Survey of IR Offices: Executive Leadership for the Data and Analytics Function [Report]. Association for Institutional Research. www.airweb.org/NationalSurvey.
Related Content
2021 AIR National Survey of IR Offices: Topic Briefs
AIR National Survey of IR Offices
Long Description
Chart 1. Current IR Office Reporting Relationship
Chart 1 is a bar chart. Numerical values presented on the image:
| Reporting Relationship | All Institutions | Public 4-year | Public 2-year | Private NFP 4-year |
|---|---|---|---|---|
| Provost/Chief Academic Officer | 58% | 63% | 36% | 66% |
| President/Chief Executive Officer | 18% | 9% | 37% | 14% |
| Independent IR/IE/Planning unit | 8% | 10% | 11% | 5% |
Chart 2. Changes to Reporting Relationships: 2021 vs. 2018
Numerical values presented on the image:
| Reporting Relationship | 2018 | 2021 |
|---|---|---|
| Administration Services | 2% | 1% |
| Other | 4% | 2% |
| Enrollment Mngt/Admissions | 4% | 3% |
| Information Technology (IT) | 4% | 4% |
| Finance/Operations/Business | 6% | 6% |
| Independent IR/IE/Planning unit | 7% | 7% |
| President/Chief Executive Officer | 17% | 14% |
| Provost/Chief Academic Officer | 56% | 63% |
Chart 3. Current vs. Ideal Reporting Relationship
Numerical values presented on the image:
| Reporting Relationship | Current Reporting Relationship | Ideal Reporting Relationship |
|---|---|---|
| Provost/Chief Academic Officer | 58% | 38% |
| President/Chief Executive Officer | 18% | 40% |
| Independent IR/IE/Planning unit | 8% | 14% |