
Professional Development
This brief is one of a series of reports. Learn more at airweb.org/nationalsurvey.
Our world of higher education data and analytics is constantly changing with new software tools, more advanced data management and governance techniques, and the need for better leadership and management skills. Without professional development, our offices would fail to meet institutional expectations.
Professional Development by Staff Roles
In the 2021 AIR National Survey, we asked office leaders to provide information about the professional development of their staff. Specifically, we were interested to understand the percentage of staff members who participate in professional development and the percentage of their work time devoted to professional development. We converted that percentage to total hours per year by assuming a 1,920-hour work year (40 hours per week for 48 weeks per year). In addition, we were interested to know the focus of the professional development. Below, we tabulate those results for each staff role.
Office Leader
We learned that 95% of IR offices have dedicated office leaders. Of those, 96% of offices participate in professional development. On average, office leaders who participate in professional development spend 82 hours per year improving their knowledge and skills; that number varied slightly by sector (Table 1).
When total time was examined by area of training, we found that, on average, 13 hours per year are spent acquiring knowledge and skills related to data management and governance and another 13 hours are spent in software tool training.
| All Institutions | Public 4-year | Public 2-year | Private NFP 4-year | |
|---|---|---|---|---|
| % of IR offices with dedicated office leaders | 95% | 97% | 95% | 95% |
| Of those, % involved in professional development | 96% | 94% | 97% | 99% |
| Of those who participate in professional development, average number of hours per year by content | ||||
| Data management/governance | 13 | 13 | 14 | 13 |
| Software tools (e.g., Tableau, R, SPSS) | 13 | 12 | 14 | 12 |
| Data visualizations/communicating results | 12 | 14 | 13 | 11 |
| Leadership/management | 11 | 13 | 12 | 9 |
| Other | 9 | 5 | 10 | 10 |
| Advanced analytics (e.g., predictive, prescriptive) | 8 | 11 | 7 | 8 |
| Technology (e.g., database, data warehouse) | 8 | 8 | 10 | 7 |
| Basic analytics (e.g., descriptive analytics) | 8 | 8 | 8 | 7 |
| Total hours per year in professional development | 82 | 84 | 88 | 77 |
Associate/Assistant Director
Survey results show that 29% of IR offices have associate/assistant directors. Of those, 97% participate in professional development for this role (Table 2). Those staff spend, on average, 111 hours per year in training with the largest block of time spent on software tool training followed by training in data visualizations/communicating results.
There are differences by sector. We found that offices in public 2-year institutions are much less likely to have this role but, for those that do, they provide significantly more hours of professional development compared to 4-year institutions. Associate/Assistant Directors at public 4-year institutions participate in the fewest number of professional development hours compared to the other two sectors.
| All Institutions | Public 4-year | Public 2-year | Private NFP 4-year | |
|---|---|---|---|---|
| % of IR offices with associate/assistant directors | 29% | 47% | 14% | 26% |
| Of those, % involved in professional development | 97% | 95% | 100% | 97% |
| Of those who participate in professional development, average number of hours per year by content | ||||
| Software tools (e.g., Tableau, R, SPSS) | 22 | 18 | 44 | 22 |
| Data visualizations/communicating results | 17 | 17 | 21 | 16 |
| Data management/governance | 16 | 13 | 17 | 19 |
| Technology (e.g., database, data warehouse) | 13 | 12 | 22 | 11 |
| Basic analytics (e.g., descriptive analytics) | 12 | 12 | 15 | 12 |
| Other | 12 | 7 | 19 | 16 |
| Advanced analytics (e.g., predictive, prescriptive) | 10 | 8 | 16 | 11 |
| Leadership/management | 8 | 9 | 12 | 6 |
| Total hours per year in professional development | 111 | 96 | 167 | 113 |
Senior Analytical Staff
Survey results show that 30% of IR offices have senior analytical staff. Of those, 97% participate in professional development for this role (Table 3). Those staff spend, on average, 104 hours per year with the largest segment of training spent in software tools and data visualizations/communicating results, similar to staff in associate/assistant director roles.
Disaggregation by sector shows a wide range of time spent in professional development activities, from 84 hours for private not-for-profit 4-year institutions to 127 hours for public 2-year institutions.
| All Institutions | Public 4-year | Public 2-year | Private NFP 4-year | |
|---|---|---|---|---|
| % of IR offices with senior analytical staff | 30% | 49% | 26% | 20% |
| Of those, % involved in professional development | 97% | 94% | 97% | 99% |
| Of those who participate in professional development, average number of hours per year by content | ||||
| Software tools (e.g., Tableau, R, SPSS) | 23 | 24 | 32 | 17 |
| Data visualizations/communicating results | 16 | 19 | 17 | 13 |
| Data management/governance | 15 | 13 | 18 | 16 |
| Advanced analytics (e.g., predictive, prescriptive) | 15 | 17 | 17 | 11 |
| Basic analytics (e.g., descriptive analytics) | 14 | 15 | 17 | 11 |
| Technology (e.g., database, data warehouse) | 11 | 12 | 11 | 8 |
| Other | 6 | 5 | 6 | 7 |
| Leadership/management | 4 | 3 | 9 | 1 |
| Total hours per year in professional development | 104 | 108 | 127 | 84 |
Analytical Staff
Slightly over half of IR offices have analytical staff (not designated as senior analytical staff as noted above). Of those, 95% participate in professional development (Table 4). On average, analytical staff spend 109 hours per year in training with the primary focus in software tools and basic analytics.
Similar to other roles, there are differences by sector. IR offices at private not-for-profit 4-year institutions dedicate the fewest hours to professional development for analytical staff while offices at public 2-year institutions devote the most hours.
| All Institutions | Public 4-year | Public 2-year | Private NFP 4-year | |
|---|---|---|---|---|
| % of IR offices with analytics staff | 53% | 84% | 51% | 37% |
| Of those, % involved in professional development | 95% | 91% | 97% | 97% |
| Of those who participate in professional development, average number of hours per year by content | ||||
| Software tools (e.g., Tableau, R, SPSS) | 25 | 27 | 28 | 21 |
| Basic analytics (e.g., descriptive analytics) | 19 | 22 | 20 | 15 |
| Data visualizations/communicating results | 18 | 20 | 18 | 16 |
| Data management/governance | 14 | 13 | 15 | 14 |
| Technology (e.g., database, data warehouse) | 12 | 12 | 16 | 8 |
| Advanced analytics (e.g., predictive, prescriptive) | 10 | 10 | 11 | 10 |
| Other | 8 | 6 | 11 | 8 |
| Leadership/management | 3 | 3 | 4 | 2 |
| Total hours per year in professional development | 109 | 113 | 124 | 94 |
Technical Staff
Only 14% of IR offices have staff dedicated to technical tasks like programming and database management. Of those, 93% participate in professional development (Table 5). Technical staff spend, on average, 115 hours per year in training with the focus on software tools and technology.
That number varies widely by sector. Offices at private not-for-profit 4-year institutions provide the fewest hours of development and offices at public institutions provide more hours.
| All Institutions | Public 4-year | Public 2-year | Private NFP 4-year | |
|---|---|---|---|---|
| % of IR offices with technical staff | 14% | 24% | 14% | 8% |
| Of those, % involved in professional development | 93% | 86% | 94% | 97% |
| Of those who participate in professional development, average number of hours per year by content | ||||
| Software tools (e.g., Tableau, R, SPSS) | 29 | 35 | 22 | 23 |
| Technology (e.g., database, data warehouse) | 28 | 34 | 27 | 20 |
| Data management/governance | 16 | 20 | 12 | 13 |
| Data visualizations/communicating results | 15 | 16 | 12 | 15 |
| Basic analytics (e.g., descriptive analytics) | 12 | 10 | 20 | 10 |
| Other | 6 | 5 | 9 | 4 |
| Leadership/management | 4 | 3 | 10 | 3 |
| Advanced analytics (e.g., predictive, prescriptive) | 4 | 4 | 3 | 4 |
| Total hours per year in professional development | 115 | 128 | 115 | 91 |
Administrative Support Staff
Survey results show that 22% of IR offices have administrative support staff. Of those, 72% provide professional development for these staff. They spend, on average, 87 hours per year in training with some differences by sector (Table 6). The largest segment of their training was not defined in the survey (write-in comments suggest specialty training in administrative tasks) followed by training in software tools.
| All Institutions | Public 4-year | Public 2-year | Private NFP 4-year | |
|---|---|---|---|---|
| % of IR offices with administrative support staff | 22% | 32% | 28% | 12% |
| Of those, % involved in professional development | 72% | 59% | 82% | 74% |
| Of those who participate in professional development, average number of hours per year by content | ||||
| Other | 25 | 29 | 28 | 11 |
| Software tools (e.g., Tableau, R, SPSS) | 16 | 14 | 19 | 15 |
| Leadership/management | 14 | 12 | 11 | 24 |
| Basic analytics (e.g., descriptive analytics) | 11 | 12 | 11 | 7 |
| Data visualizations/communicating results | 9 | 10 | 7 | 11 |
| Technology (e.g., database, data warehouse) | 6 | 2 | 10 | 8 |
| Data management/governance | 6 | 6 | 9 | 4 |
| Advanced analytics (e.g., predictive, prescriptive) | 1 | 1 | 1 | 1 |
| Total hours per year in professional development | 87 | 85 | 95 | 81 |
Comparing Roles
Comparing the six staff roles reported, technical staff have the highest average number of hours of professional development by year (115) while office leaders have the least (82); Table 7.
Identification of the top two areas of professional development by role shows that each one devotes time to software tools. In addition, associate/assistant directors and senior analytical staff devote training time to data visualizations/communicating results, office leaders to data management and governance, analysts to learning basic analytics, technical staff to technology-related training, and administrative staff to other forms of training.
| Avg # of Hours of Professional Development per Year | Software tools | Data visualizations / communicating results | Data management / governance | Basic analytics | Technology | Other | |
|---|---|---|---|---|---|---|---|
| Technical Staff | 115 | x | x | ||||
| Associate/Assistant Director | 111 | x | x | ||||
| Analytical Staff | 109 | x | x | ||||
| Senior Analytical Staff | 104 | x | x | ||||
| Administrative Support Staff | 87 | x | x | ||||
| Office Leader | 82 | x | x |
Evaluation of Professional Development
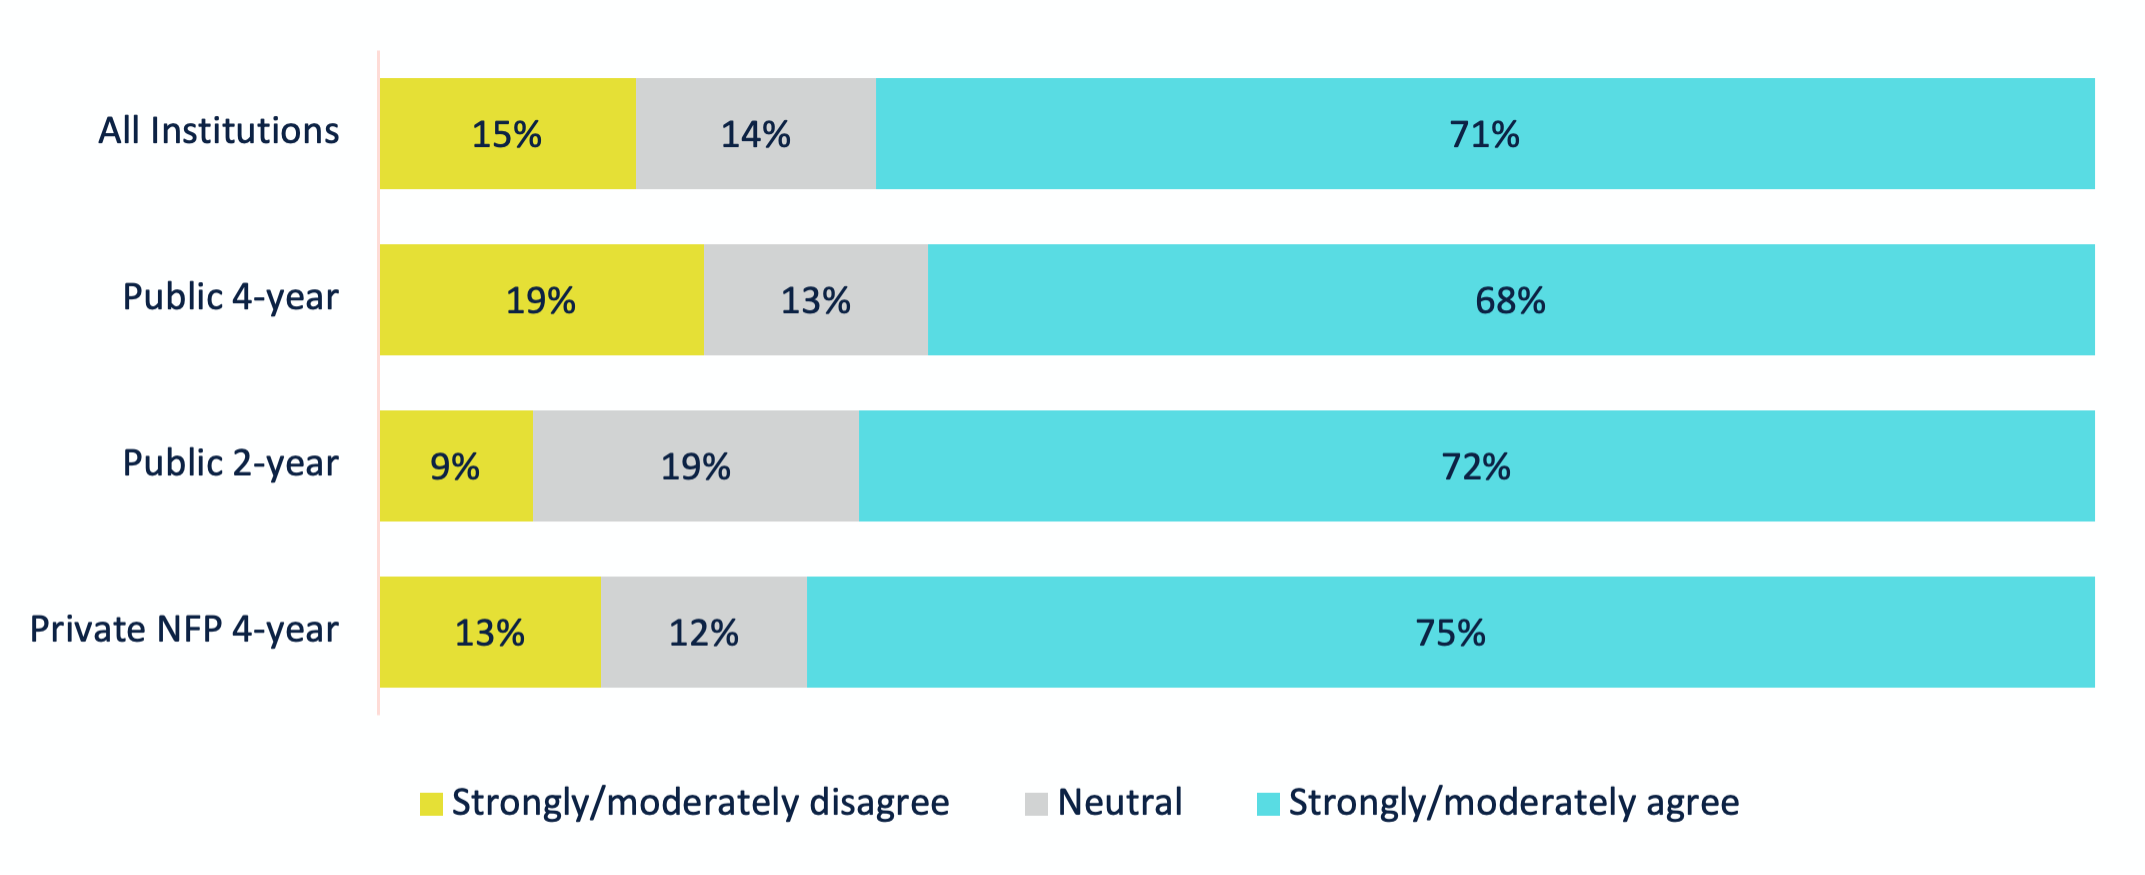
We asked office leaders to indicate whether office professional development/training opportunities are adequate to meet institutional expectations using a 5-point Agree Likert-scale (Chart 1). Overall, 7 in 10 office leaders believe their office professional development opportunities are adequate.
Although IR offices at private not-for-profit 4-year institutions provide fewer hours of professional development in comparison to public sector institutions, a slightly higher percentage of office leaders agreed that their professional development was adequate to meet institutional expectations compared to office leaders at public institutions.
Chart 1. Office professional development/training opportunities are adequate to meet institutional expectations
Methodology
The 2021 AIR National Survey of IR Offices attempted to survey IR office leaders at more than 3,000 postsecondary degree-granting institutions. Institutions of all sectors, types of control, and sizes were included in the sample. In total, responses were collected from 1,142 institutions, and 554 of those institutions completed the survey in full. To ensure comparable results, incomplete responses are excluded from this report. In addition, responses from for-profit institutions, administrative units, international institutions, private not-for-profit 2-year institutions, and institutions in U.S. territories are excluded due to low response rates.
The findings presented in this report are based on 520 responses that represent U.S. postsecondary, degree-granting institutions at public 4-year (146 institutions), public 2-year (125 institutions), or private not-for-profit 4-year institutions (249 institutions).
Suggested Citation
Jones, D. & Keller, C. (2022). 2021 AIR National Survey of IR Offices: Professional Development [Report]. Association for Institutional Research. www.airweb.org/NationalSurvey.
Related Content
2021 AIR National Survey of IR Offices: Topic Briefs
AIR National Survey of IR Offices
Long Description
Chart 1. Office professional development/training opportunities are adequate to meet institutional expectations
Chart 1 is a bar chart. Numerical values presented on the image:
| Private NFP 4-year | Public 2-year | Public 4-year | All Institutions | |
|---|---|---|---|---|
| Strongly/moderately disagree | 13% | 9% | 19% | 15% |
| Neutral | 12% | 19% | 13% | 14% |
| Strongly/moderately agree | 75% | 72% | 68% | 71% |