
IR Office Work
This brief is one of a series of reports. Learn more at airweb.org/nationalsurvey.
Although the “why” of institutional research (IR) is clear—using data to inform decisions that improve higher education and student success—the “what” is more complex. The work of each IR office is tailored to meet the unique needs of its institution. To examine the IR office’s work functions, the 2021 AIR National Survey of IR Offices sought to identify what the “average” office focuses on.
Focus of the IR Office
We asked IR office leaders to estimate the percentage of effort spent on work across several categories. On average, half of their offices’ work is devoted to mandatory reporting, the production of information for decision support, and non-compliance reporting (Chart 1).
Chart 1. Percentage of IR Office Work by Category
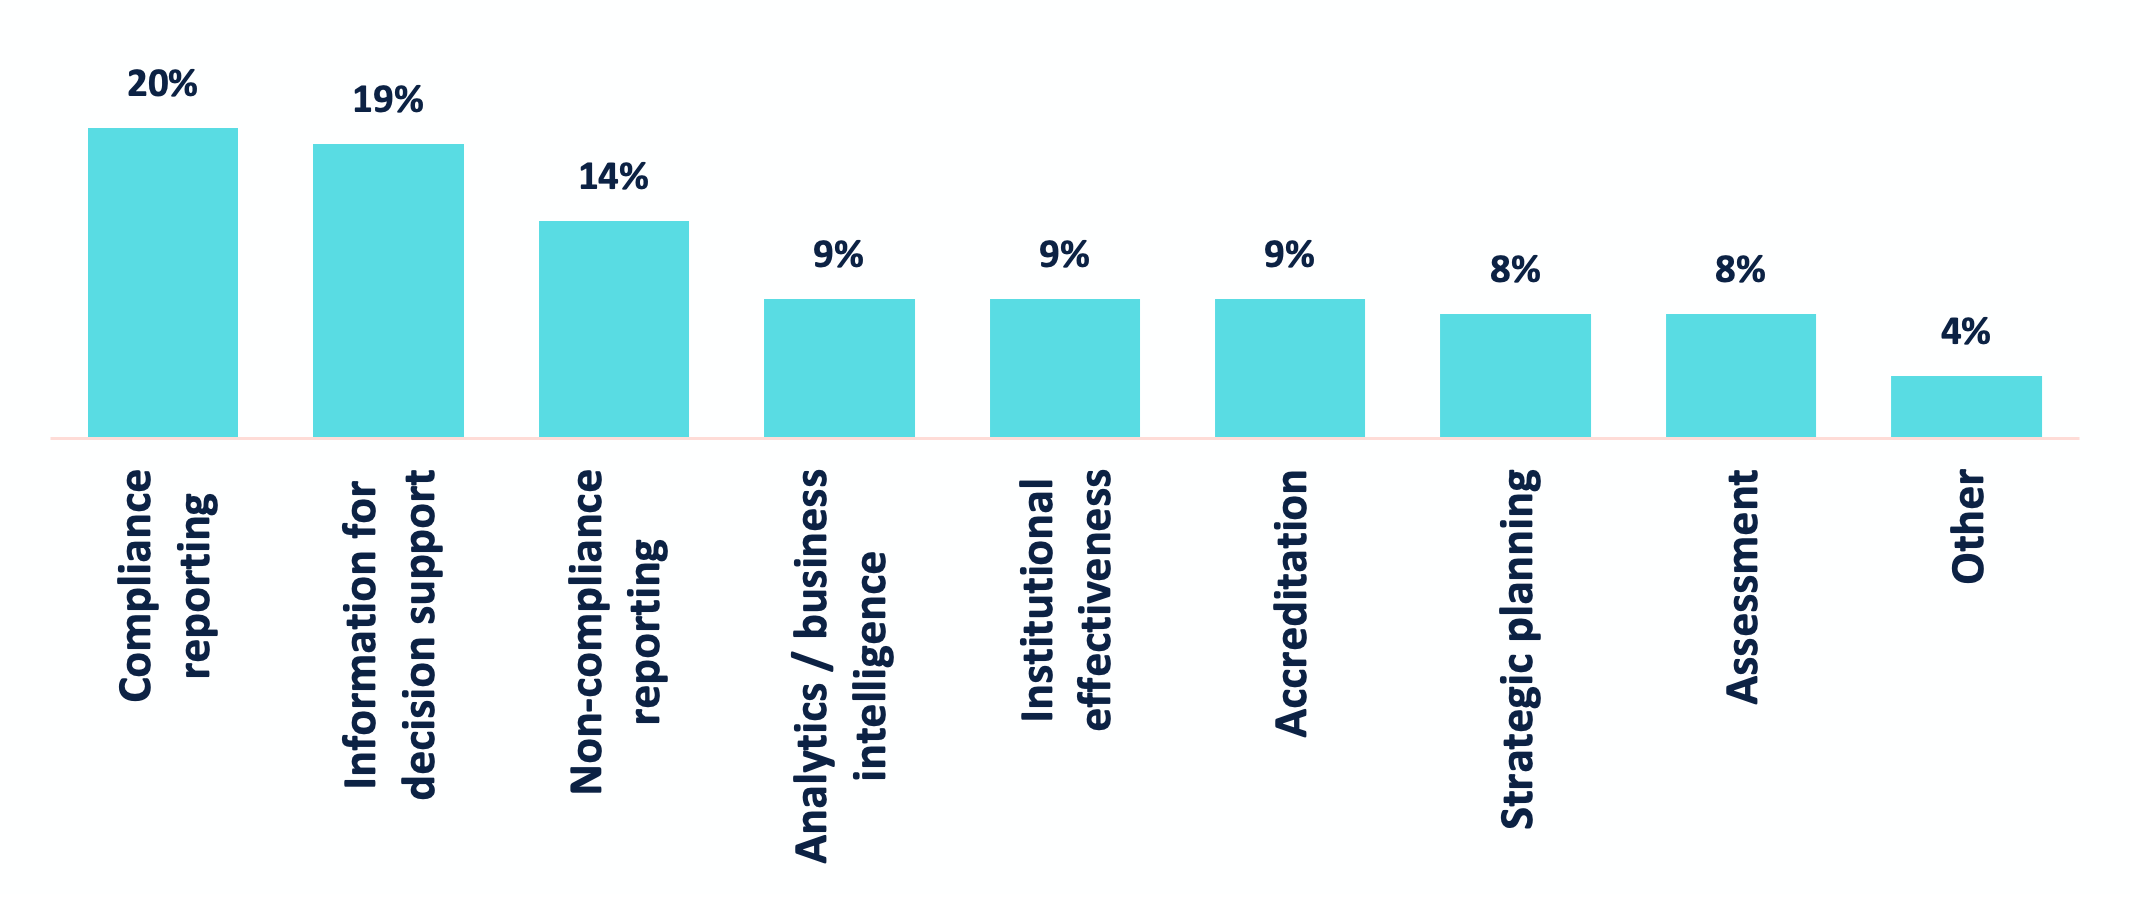
The remaining IR office work is about equally divided across institutional effectiveness (IE), accreditation, assessment, analytics, and strategic planning. Only 4% of office leaders report work beyond these categories.
A comparison across major sectors (i.e., public 4-year, public 2-year, and private not-for-profit 4-year institutions) reveal a similar pattern with a few slight differences (Table 1). For example, IR offices at public 2-year institutions spend less time on reporting and more time on IE compared to 4-year institutions. IR offices at public 4-year institutions spend more time in strategic planning than the other two sectors while IR offices at private, not-for-profit, 4-year institutions spend more time on non-compliance reporting than the other two sectors.
| Category | All Institutions | Public 4-year | Public 2-year | Private NFP 4-year |
|---|---|---|---|---|
| Compliance reporting | 20% | 20% | 20% | 20% |
| Information for decision support | 19% | 20% | 19% | 18% |
| Non-compliance reporting | 14% | 14% | 11% | 16% |
| Institutional effectiveness | 9% | 8% | 11% | 9% |
| Accreditation | 9% | 7% | 9% | 9% |
| Assessment | 8% | 7% | 9% | 7% |
| Analytics / business intelligence | 9% | 8% | 10% | 10% |
| Strategic planning | 8% | 11% | 7% | 7% |
| Other | 4% | 5% | 4% | 4% |
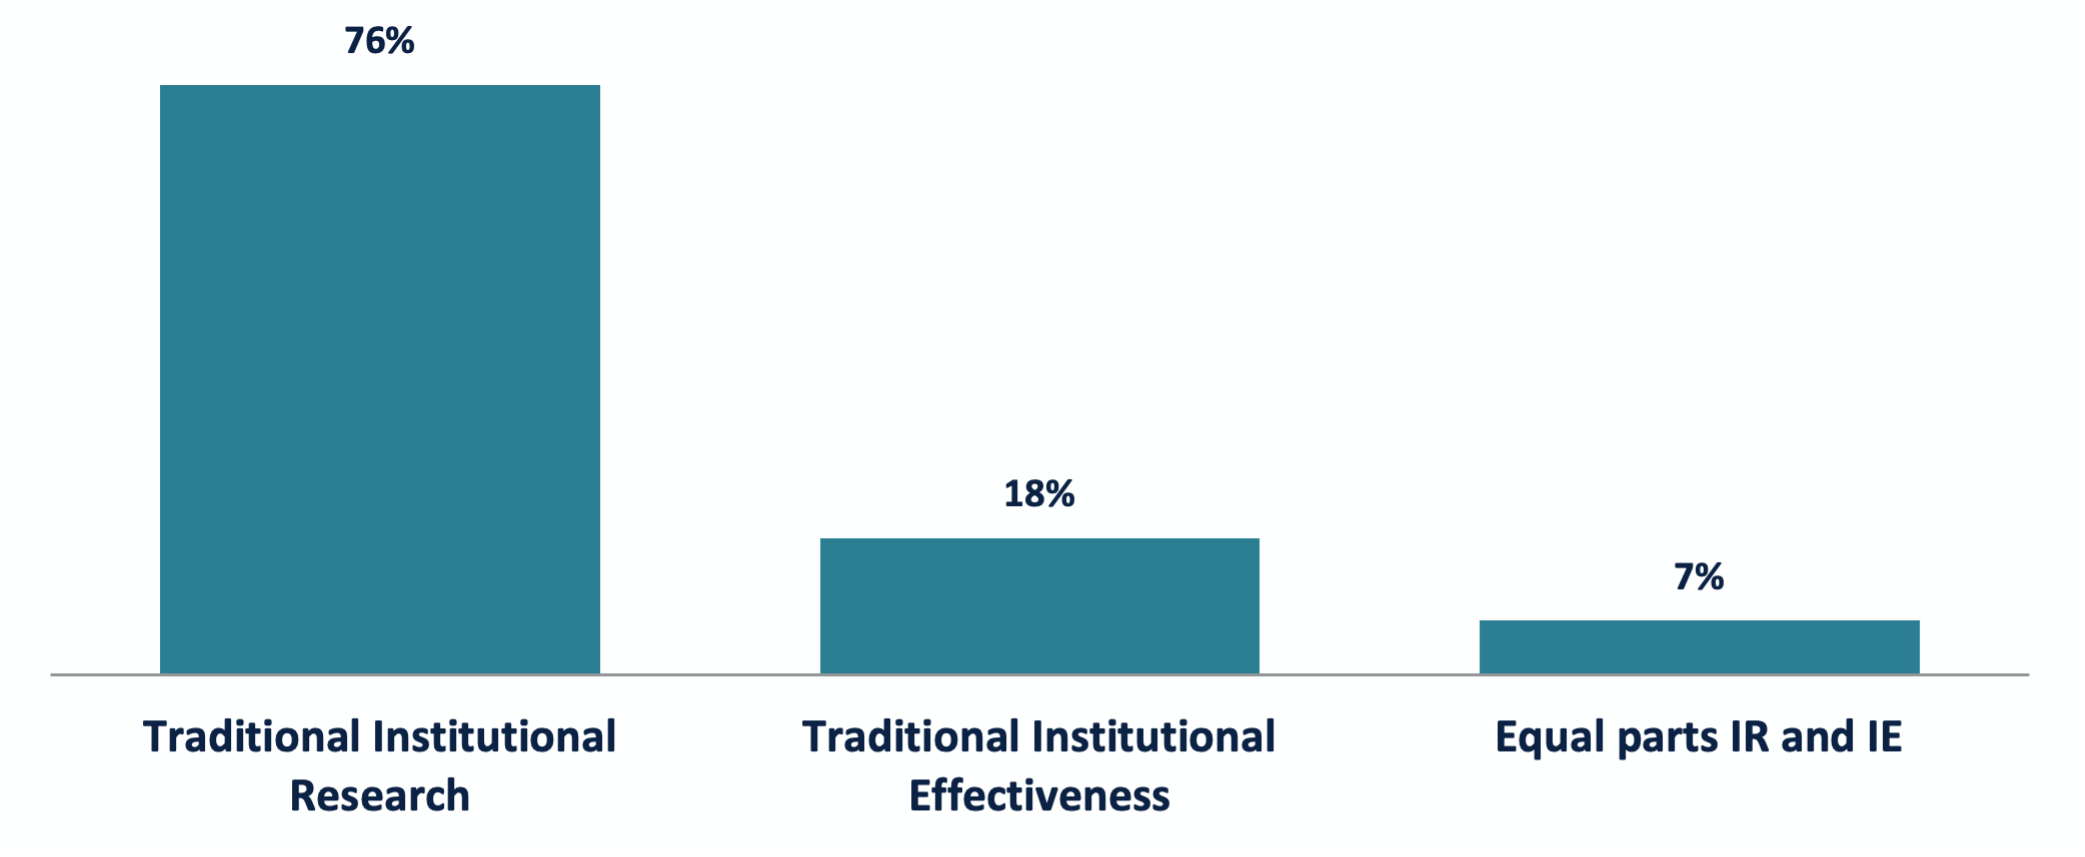
To get a clearer picture of the individual IR office, we classified work functions into two main categories: traditional IR (i.e., reporting, decision support, and analytics/business intelligence or BI) and traditional IE (i.e., IE, assessment, accreditation, and planning). Then, we classified each IR office as predominantly IR-focused, IE-focused, or an equal mix based on the percentage of effort spent on the various work functions.
Survey data reveal that 76% of offices are primarily focused on traditional IR, 18% are primarily focused on traditional IE, and 7% spend equal amounts of time on both IR and IE (Chart 2).
Chart 2. Classification of IR Offices Based on Work Focus
There are differences in IR office classifications by sector. A higher percentage of IR offices at public 4-year institutions focus primarily on traditional IR compared to the other sectors while a higher percentage of IR offices at public 2-year institutions are focused primarily on traditional IE (Table 2).
| Classification | All Institutions | Public 4-year | Public 2-year | Private NFP 4-year |
|---|---|---|---|---|
| Traditional Institutional Research | 76% | 87% | 66% | 73% |
| Traditional Institutional Effectiveness | 18% | 8% | 28% | 18% |
| Equal parts IR and IE | 7% | 5% | 6% | 8% |
There were 259 IR offices who responded to both the 2018 and the 2021 AIR National Surveys who also provided information about their IR office work. Conducting the same classification on the 2018 survey data, we found a slight shift towards more traditional IR work and away from traditional IE work. This shift appears for all three major sectors (Table 3).
| Classification | All Institutions | Public 4-year | Public 2-year | Private NFP 4-year | ||||
|---|---|---|---|---|---|---|---|---|
| 2021 | 2018 | 2021 | 2018 | 2021 | 2018 | 2021 | 2018 | |
| Traditional IR | 80% | 74% | 89% | 82% | 67% | 65% | 77% | 72% |
| Traditional IE | 15% | 19% | 7% | 11% | 28% | 33% | 17% | 19% |
| Equal parts IR and IE | 5% | 7% | 4% | 7% | 4% | 2% | 6% | 9% |
In addition to participating in office work, IR staff members may also serve in institutional roles and committees. We found that nearly all IR offices have a staff member serving as the institution’s IPEDS Keyholder and on the institution’s data governance structure committee, but only one-third of offices have a staff member serving as the regional or national accreditor liaison officer (Table 4).
| Roles and Committees | All Institutions | Public 4-year | Public 2-year | Private NFP 4-year |
|---|---|---|---|---|
| Serves as the institution’s IPEDS Keyholder | 91% | 91% | 86% | 93% |
| Involved with data governance structure or committee | 90% | 92% | 92% | 87% |
| Serves as regional/national accreditor liaison officer | 35% | 26% | 41% | 38% |
Conducting Research and Predictive Analytics
Part of IR’s work is providing information for decision support which likely incorporates research. But how prevalent are those research projects? We asked office leaders how often their office conducts quantitative and qualitative research and predictive analytics. We found that 93% conduct quantitative research projects a few times a year or more, 69% conduct predictive analytics work a few times a year or more, and 58% conduct qualitative research projects a few times a year or more (Table 5). We also found that offices at public 4-year institutions are more likely to conduct predictive analytics than their colleagues in the other two sectors.
| All Institutions | Public 4-year | Public 2-year | Private NFP 4-year | |
|---|---|---|---|---|
| Quantitative research projects (e.g., survey research, longitudinal studies) | ||||
| Not in the past year | 7% | 5% | 7% | 8% |
| A few times a year | 62% | 58% | 61% | 64% |
| A few times a month or weekly | 32% | 37% | 31% | 29% |
| Qualitative research projects (e.g., focus groups, interviews, document analyses) | ||||
| Not in the past year | 42% | 41% | 35% | 46% |
| A few times a year | 52% | 52% | 57% | 49% |
| A few times a month or weekly | 6% | 8% | 8% | 4% |
| Predictive analytics | ||||
| Not in the past year | 30% | 17% | 43% | 31% |
| A few times a year | 59% | 67% | 48% | 61% |
| A few times a month or weekly | 10% | 17% | 8% | 6% |
Student Success
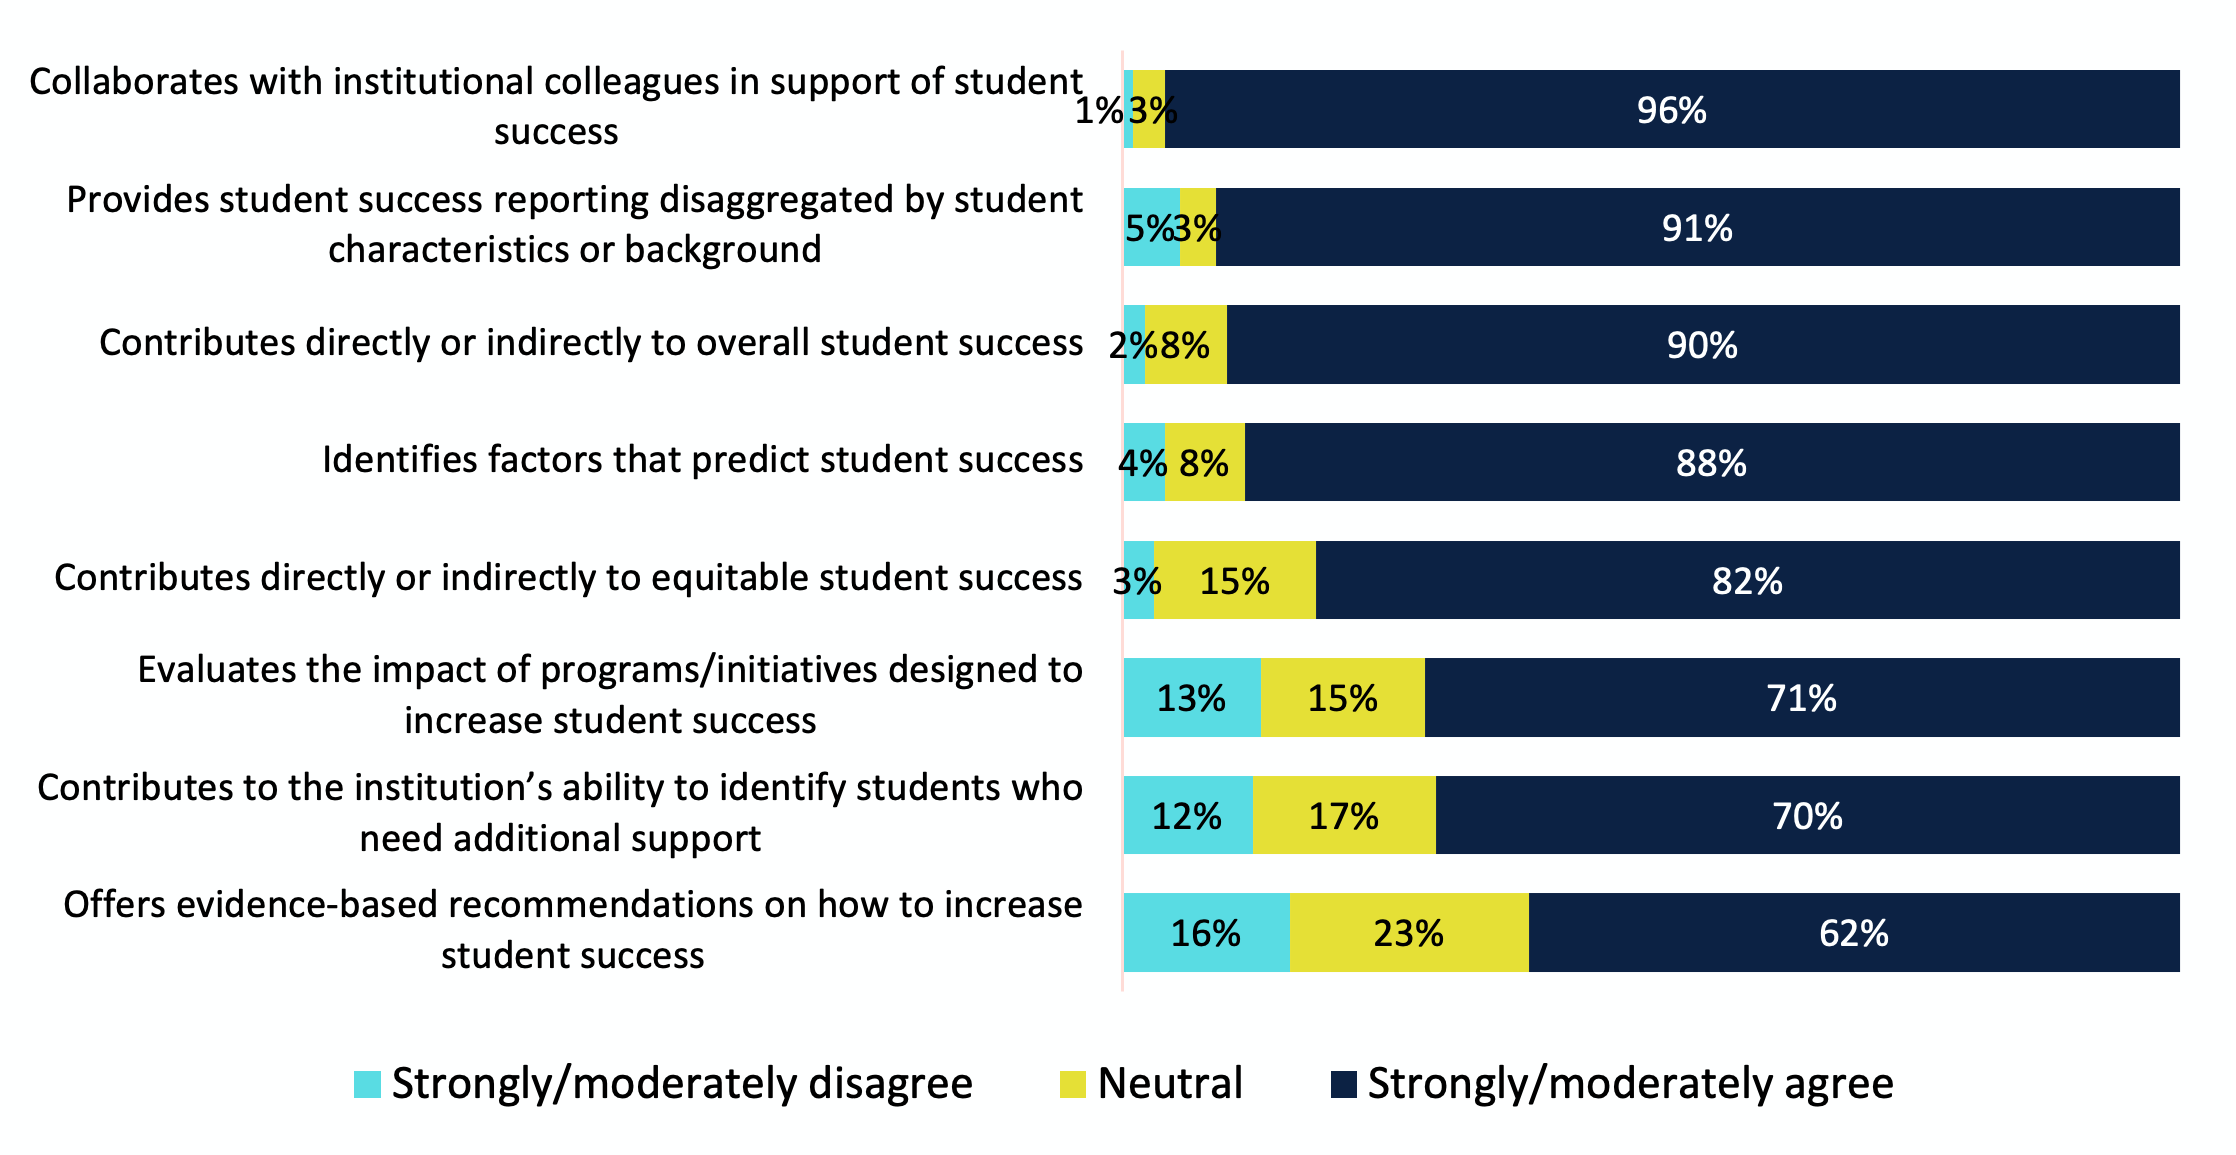
Most IR offices provide information for decision support. But is that information linked to student success? We asked office leaders to evaluate the degree to which their offices contribute to institutional student success efforts using a 5-point Agreement Likert scale. We found that nearly every IR office supports institutional colleagues and provides information disaggregated by student characteristics and background to help identify equity gaps. However, far fewer offices play active roles like contributing to their institutions’ abilities to identify students who need additional support or to provide recommendations on ways to increase student success (Chart 3).
Chart 3. Contribution of IR Office to Student Success
Combining the two highest points on the 5-point Agreement Likert scale, we find some difference in these statements by sector. IR offices at public 2-year institutions are more likely to evaluate the impact of programs and initiatives designed to increase student success compared to colleagues at 4-year institutions; this may be due, in part, to greater focus on institutional effectiveness in the public 2-year sector (Table 6).
In addition, IR offices at public 4-year and 2-year institutions are more likely to play active roles in student success compared to offices at private, not-for-profit, 4-year institutions (e.g., identifying students needing additional support, providing recommendations to increase student success); this may be due, in part, to larger staff sizes.
| All Institutions | Public 4-year | Public 2-year | Private NFP 4-year | |
|---|---|---|---|---|
| Collaborates with institutional colleagues in support of student success | 96% | 93% | 98% | 97% |
| Provides student success reporting disaggregated by student characteristics or background | 91% | 94% | 91% | 89% |
| Contributes directly or indirectly to overall student success | 90% | 90% | 90% | 90% |
| Identifies factors that predict student success | 88% | 88% | 89% | 88% |
| Contributes directly or indirectly to equitable student success | 82% | 85% | 85% | 78% |
| Evaluates the impact of programs/initiatives designed to increase student success | 71% | 72% | 87% | 63% |
| Contributes to the institution’s ability to identify students who need additional support | 70% | 77% | 76% | 64% |
| Offers evidence-based recommendations on how to increase student success | 62% | 67% | 66% | 57% |
Top Five IR Office Stakeholders Understanding the primary stakeholders of the IR office provides insight into their work. We asked office leaders to identify the level of utilization of their offices’ data and analytics products and coaching services by a wide range of internal and external units; Chart 4 lists the top five stakeholders.
Chart 4. Top 5 Units Using IR Products or Coaching Services: % High or Very High Utilization
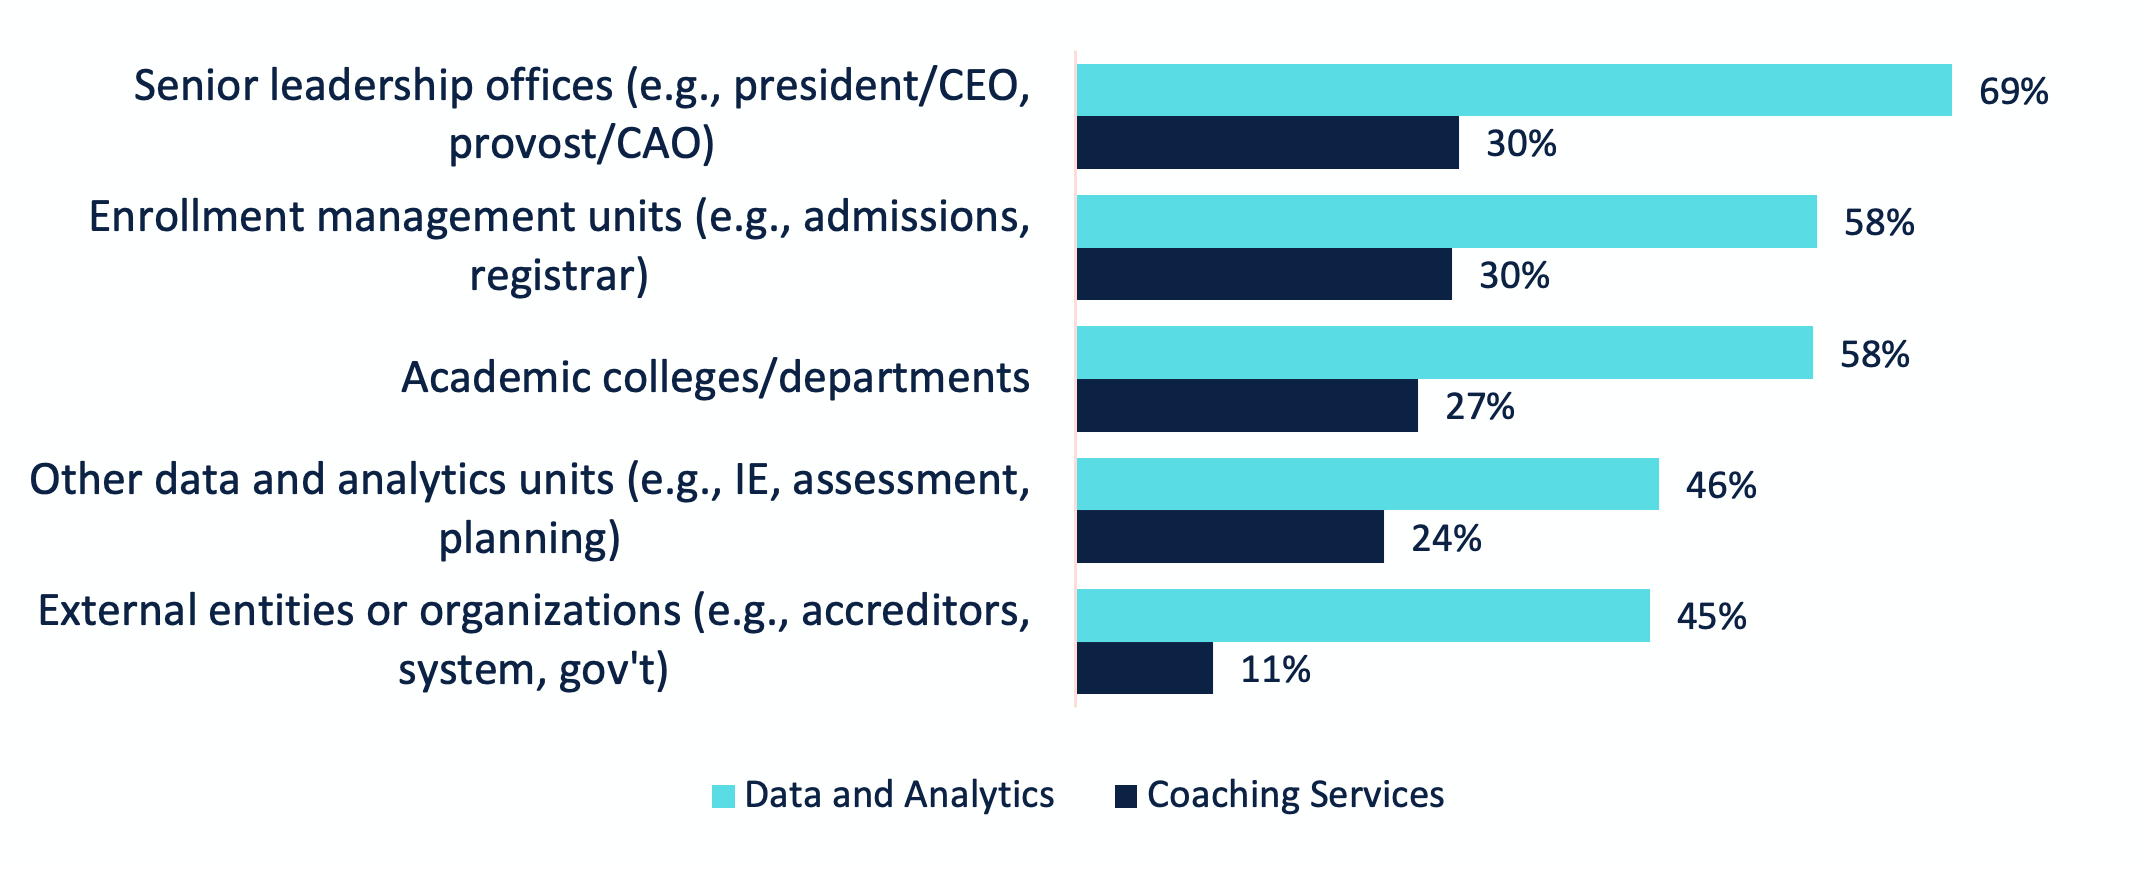
NOTE: Data were collected using a 5-point Likert scale (1. Does not utilize, 2. Low utilization, 3. Moderate utilization, 4. High utilization, 5. Very high utilization). For this chart, the percentage of respondents to the two highest points were combined.
There are some notable differences by institutional sector (Table 7). For example, a higher percentage of the IR offices at the two public sectors report high or very high utilization of their data and analytics products compared to offices at private, not-for-profit, 4-year institutions. In addition, a higher percentage of offices at public 2-year institutions report utilization of their coaching services compared to colleagues at 4-year institutions.
| Unit | All Institutions | Public 4-year | Public 2-year | Private NFP 4-year | ||||
|---|---|---|---|---|---|---|---|---|
| Data and Analytics | Coaching Services | Data and Analytics | Coaching Services | Data and Analytics | Coaching Services | Data and Analytics | Coaching Services | |
| Senior leadership offices | 69% | 30% | 75% | 32% | 78% | 41% | 61% | 24% |
| Enrollment management units | 58% | 30% | 71% | 34% | 65% | 33% | 48% | 25% |
| Academic colleges/ departments | 58% | 27% | 68% | 29% | 63% | 30% | 49% | 24% |
| Other data and analytics units | 46% | 24% | 48% | 22% | 54% | 36% | 41% | 20% |
| External entities or organizations | 45% | 11% | 50% | 8% | 43% | 13% | 43% | 11% |
Methodology
The 2021 AIR National Survey of IR Offices attempted to survey IR office leaders at more than 3,000 postsecondary degree-granting institutions. Institutions of all sectors, types of control, and sizes were included in the sample. In total, responses were collected from 1,142 institutions, and 554 of those institutions completed the survey in full. To ensure comparable results, incomplete responses are excluded from this report. In addition, responses from for-profit institutions, administrative units, international institutions, private not-for-profit 2-year institutions, and institutions in U.S. territories are excluded due to low response rates.
The findings presented in this report are based on 520 responses that represent U.S. postsecondary, degree-granting institutions at public 4-year (146 institutions), public 2-year (125 institutions), or private not-for-profit 4-year institutions (249 institutions).
Suggested Citation
Jones, D., Keller, C., & Raza, Z., (2022). 2021 AIR National Survey of IR Offices: Executive Leadership for the Data and Analytics Function [Report]. Association for Institutional Research. www.airweb.org/NationalSurvey.
Related Content
2021 AIR National Survey of IR Offices: Topic Briefs
AIR National Survey of IR Offices
Long Description
Chart 1. Percentage of IR Office Work by Category
Chart 1 is a bar chart showing office leaders to estimate the percentage of effort spent on work across the following categories. Numerical values presented on the image:
| Category | All Institutions |
|---|---|
| Compliance reporting | 20% |
| Information for decision support | 19% |
| Non-compliance reporting | 14% |
| Analytics / business intelligence | 9% |
| Institutional effectiveness | 9% |
| Accreditation | 9% |
| Strategic planning | 8% |
| Assessment | 8% |
| Other | 4% |
Chart 2. Classification of IR Offices Based on Work Focus
Numerical values presented on the image:
| Work Focus | All Institutions |
|---|---|
| Traditional Institutional Research | 76% |
| Traditional Institutional Effectiveness | 18% |
| Equal parts IR and IE | 7% |
Chart 3. Contribution of IR Office to Student Success
Numerical values presented on the image:
| Contribution | Strongly/moderately disagree | Neutral | Strongly/moderately agree |
|---|---|---|---|
| Offers evidence-based recommendations on how to increase student success | 16% | 23% | 62% |
| Contributes to the institution’s ability to identify students who need additional support | 12% | 17% | 70% |
| Evaluates the impact of programs/initiatives designed to increase student success | 13% | 15% | 71% |
| Contributes directly or indirectly to equitable student success | 3% | 15% | 82% |
| Identifies factors that predict student success | 4% | 8% | 88% |
| Contributes directly or indirectly to overall student success | 2% | 8% | 90% |
| Provides student success reporting disaggregated by student characteristics or background | 5% | 3% | 91% |
| Collaborates with institutional colleagues in support of student success | 1% | 3% | 96% |
Chart 4. Top 5 Units Using IR Products or Coaching Services: % High or Very High Utilization
Numerical values presented on the image:
| Unit | Coaching Services | Data and Analytics |
|---|---|---|
| External entities or organizations (e.g., accreditors, system, gov't) | 11% | 45% |
| Other data and analytics units (e.g., IE, assessment, planning) | 24% | 46% |
| Academic colleges/departments | 27% | 58% |
| Enrollment management units (e.g., admissions, registrar) | 30% | 58% |
| Senior leadership offices (e.g., president/CEO, provost/CAO) | 30% | 69% |