IR Office Staff Roles, FTE, and Characteristics
This brief is one of a series of reports. Learn more at airweb.org/nationalsurvey.
The responsibilities and duties that constitute institutional research (IR) vary from one institution to another; however, IR and data professionals are essential to accomplish the work. In the 2021 AIR National Survey of IR Offices, we asked IR office leaders to tell us about staff roles and staff sizes, hours worked per week, and to evaluate the adequacy of their staff sizes.
Office Roles and Staff FTE
The 2021 National Survey revealed that nearly all IR offices represented in the survey data have official office leaders with titles of director of institutional research, associate provost for institutional research and effectiveness, or similar. Likewise, most IR offices have analytical staff.
However, only about one in four IR offices have roles beyond analytical staff, such as associate/assistant directors or technical, administrative, and student staff. For the purpose of this study, analytical staff are defined as employees whose primary responsibilities are analyses and reporting. Technical staff are employees whose primary responsibilities are technical tasks, such as software programming and database management.
There are substantial differences in IR offices’ staff roles by major sector: public 4-year, public 2-year, and private not-for-profit 4-year. While most IR offices have leaders regardless of sector, public 4-year institutions are more likely to have additional staff roles than public 2-year institutions and private not-for-profit 4-year institutions (Table 1).
| Staff Role | All Institutions | Public 4-year | Public 2-year | Private NF 4-year |
|---|---|---|---|---|
| Office Leader | 95% | 97% | 95% | 95% |
| Associate/Assistant Directors | 29% | 47% | 14% | 26% |
| Senior Analytical Staff | 30% | 49% | 26% | 20% |
| Analytical Staff | 53% | 84% | 51% | 37% |
| Technical Staff | 14% | 24% | 14% | 8% |
| Administrative Support Staff | 22% | 32% | 28% | 12% |
| Student Staff | 17% | 21% | 4% | 20% |
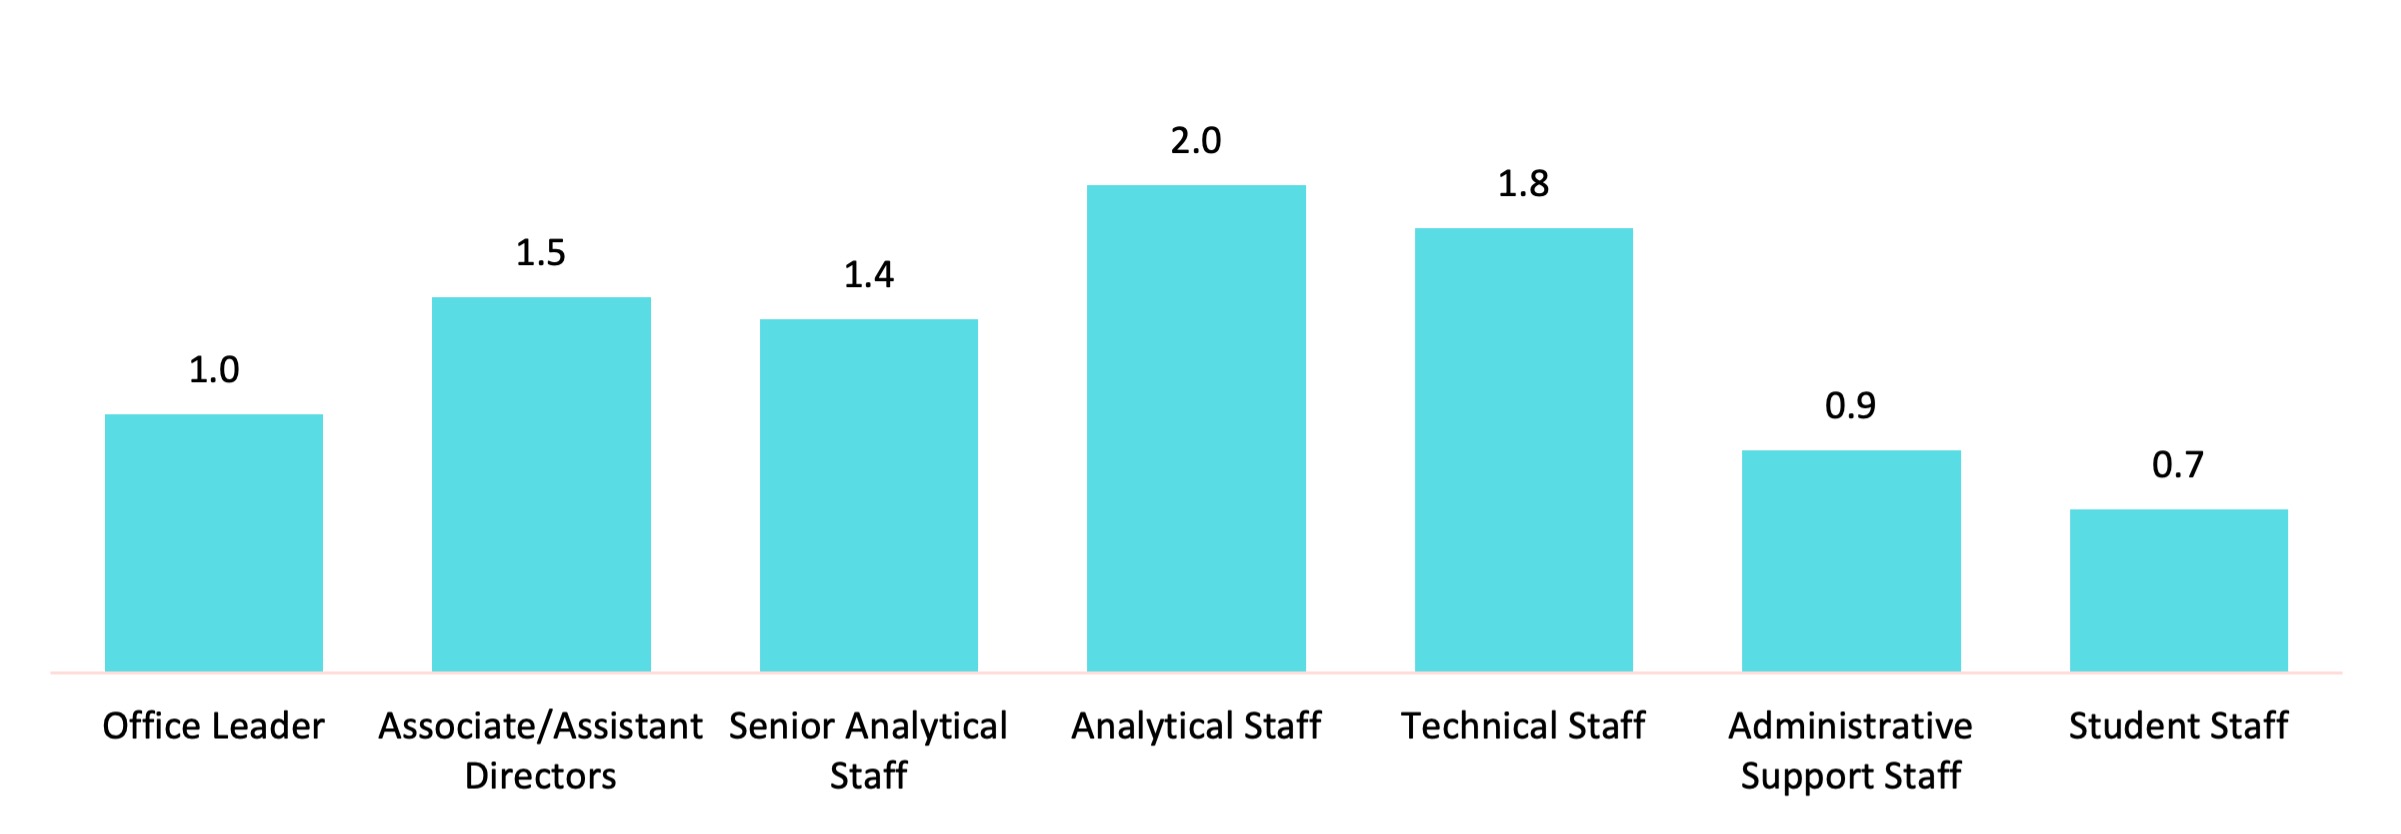
Chart 1 shows the average FTEs of specific staff roles.
Chart 1. Average FTE by Staff Role

Image Description Note: FTE = full-time equivalent.
Next, we calculated the average full-time equivalent (FTE) staff role by multiplying the percentage of IR offices with the specific role type by the average staff FTE for that role (Table 2). We found that the average IR office has a staff FTE of 3.5, ranging from a high of 5.8 FTE at public 4-year institutions to a low of 2.4 FTE at private not-for-profit 4-year institutions.
| Staff Role | All Institutions | Public 4-year | Public 2-year | Private NFP 4-year |
|---|---|---|---|---|
| Office Leader | 1.0 | 1.1 | 1.0 | 1.0 |
| Associate/Assistant Directors | 0.4 | 0.8 | 0.2 | 0.3 |
| Senior Analytical Staff | 0.4 | 0.8 | 0.4 | 0.3 |
| Analytical Staff | 1.0 | 2.2 | 0.8 | 0.5 |
| Technical Staff | 0.3 | 0.5 | 0.2 | 0.1 |
| Administrative Support Staff | 0.2 | 0.3 | 0.3 | 0.1 |
| Student Staff | 0.1 | 0.2 | 0.1 | 0.1 |
| TOTAL | 3.5 | 5.8 | 2.8 | 2.4 |
Note: FTE = full-time equivalent.
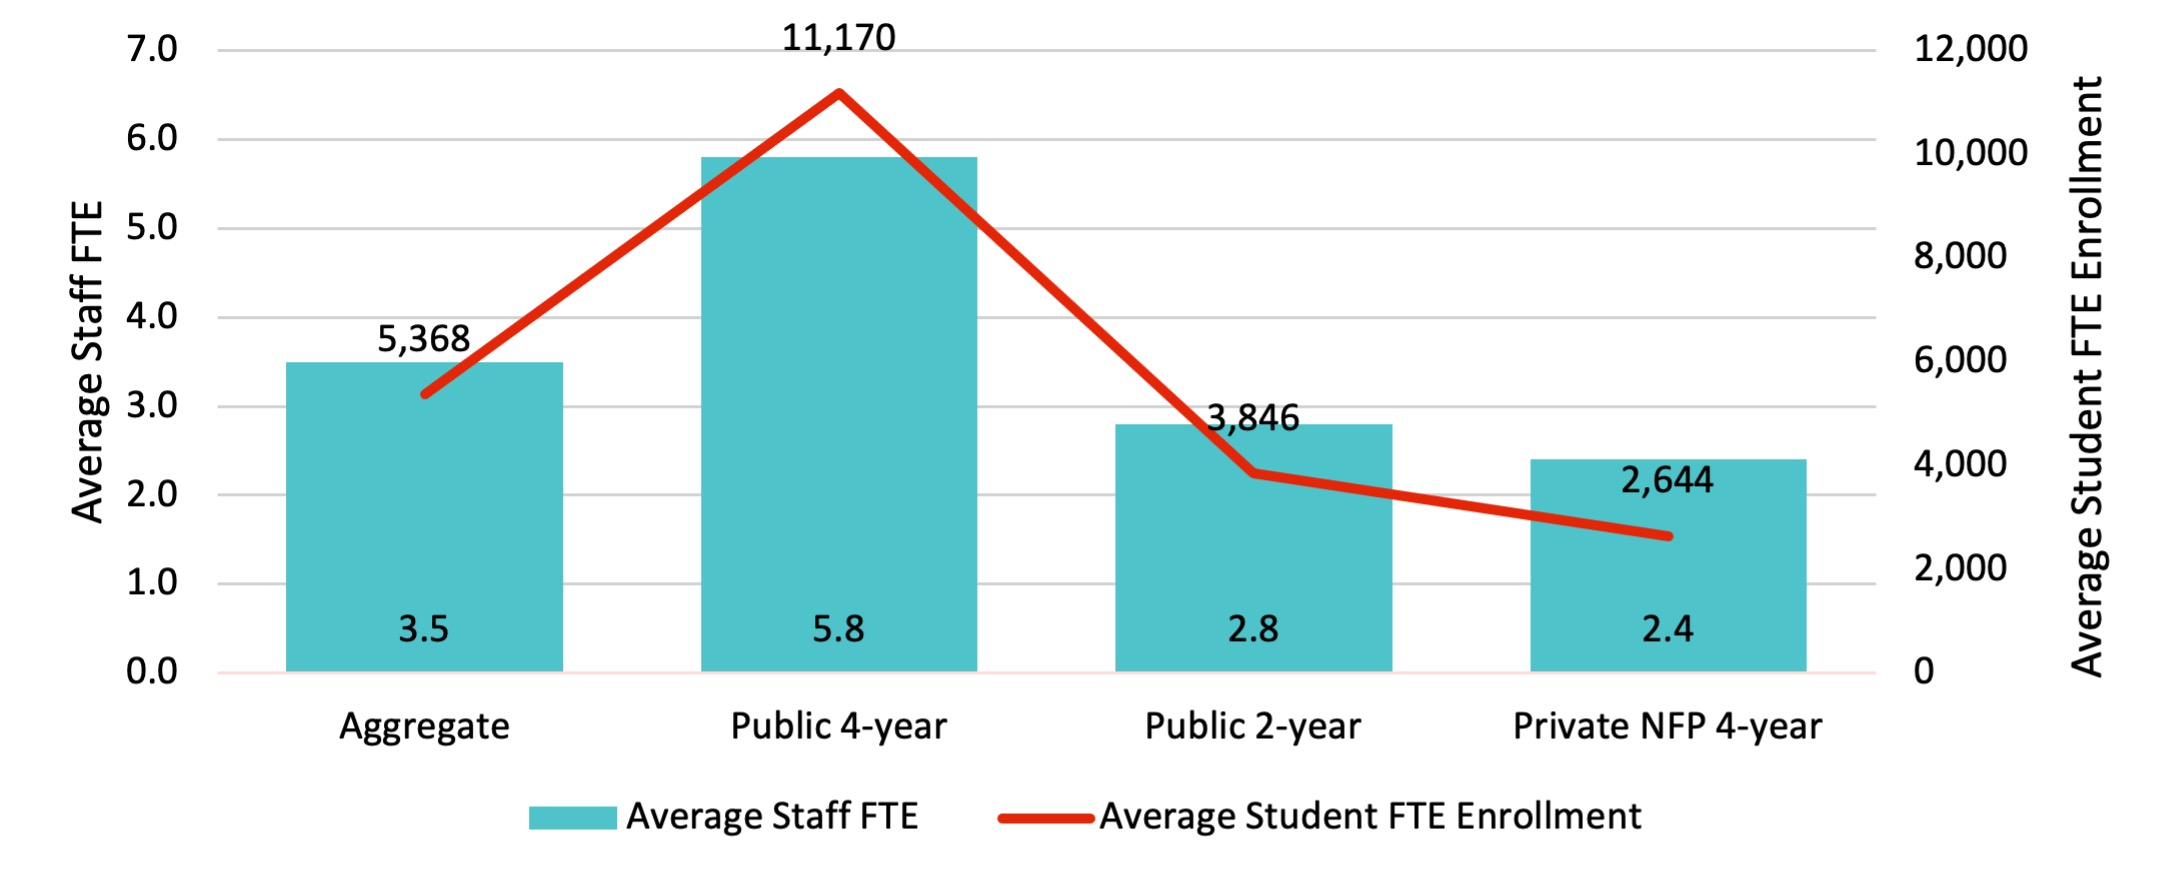
The survey findings indicate that IR office staff FTE correlates with institutional enrollment (e.g., all enrolled degree-seeking student FTEs) for the institutions that responded to the survey. Chart 2 shows the average IR office staff FTE by sector overlaid with the average student FTE enrollment in aggregate for the three major sectors. Of the institutions that responded to the survey, public 4-year institutions have nearly triple the enrollment of public 2-year institutions, and their IR offices have about triple the IR office staff FTE. Further, public 4-year institutions have more than quadruple the enrollment of private not-for-profit 4-year institutions and much larger IR office staffs.
Chart 2. Relationship between IR Office Staff FTE and Student FTE Enrollment

Note: FTE = full-time equivalent. Enrollment data reported from the 2019 Integrated Postsecondary Education Data System (IPEDS).
Table 3 presents the average IR office staff FTE by institutional enrollment range and institutional sector. As this table confirms, institutions with smaller enrollments have smaller IR office staff sizes and institutions with larger enrollments have much larger IR office staff sizes.
| Institutional Enrollment | All Institutions | Public 4-year | Public 2-year | Private NFP 4-year |
|---|---|---|---|---|
| Less than 3,000 student FTE | 1.9 | 2.4 | 2.1 | 1.8 |
| 3,000 to 4,999 student FTE | 3.0 | 3.5 | 3.4 | 2.5 |
| 5,000 to 9,999 student FTE | 3.7 | 4.0 | 3.2 | 3.8 |
| 10,000 to 19,999 student FTE | 6.0 | 6.5 | 5.5 | 4.9 |
| 20,000 or more student FTE | 10.5 | 10.9 | 9.5 | 7.9 |
Note: FTE = full-time equivalent.
Evaluation of Staff Size by IR Office Leader
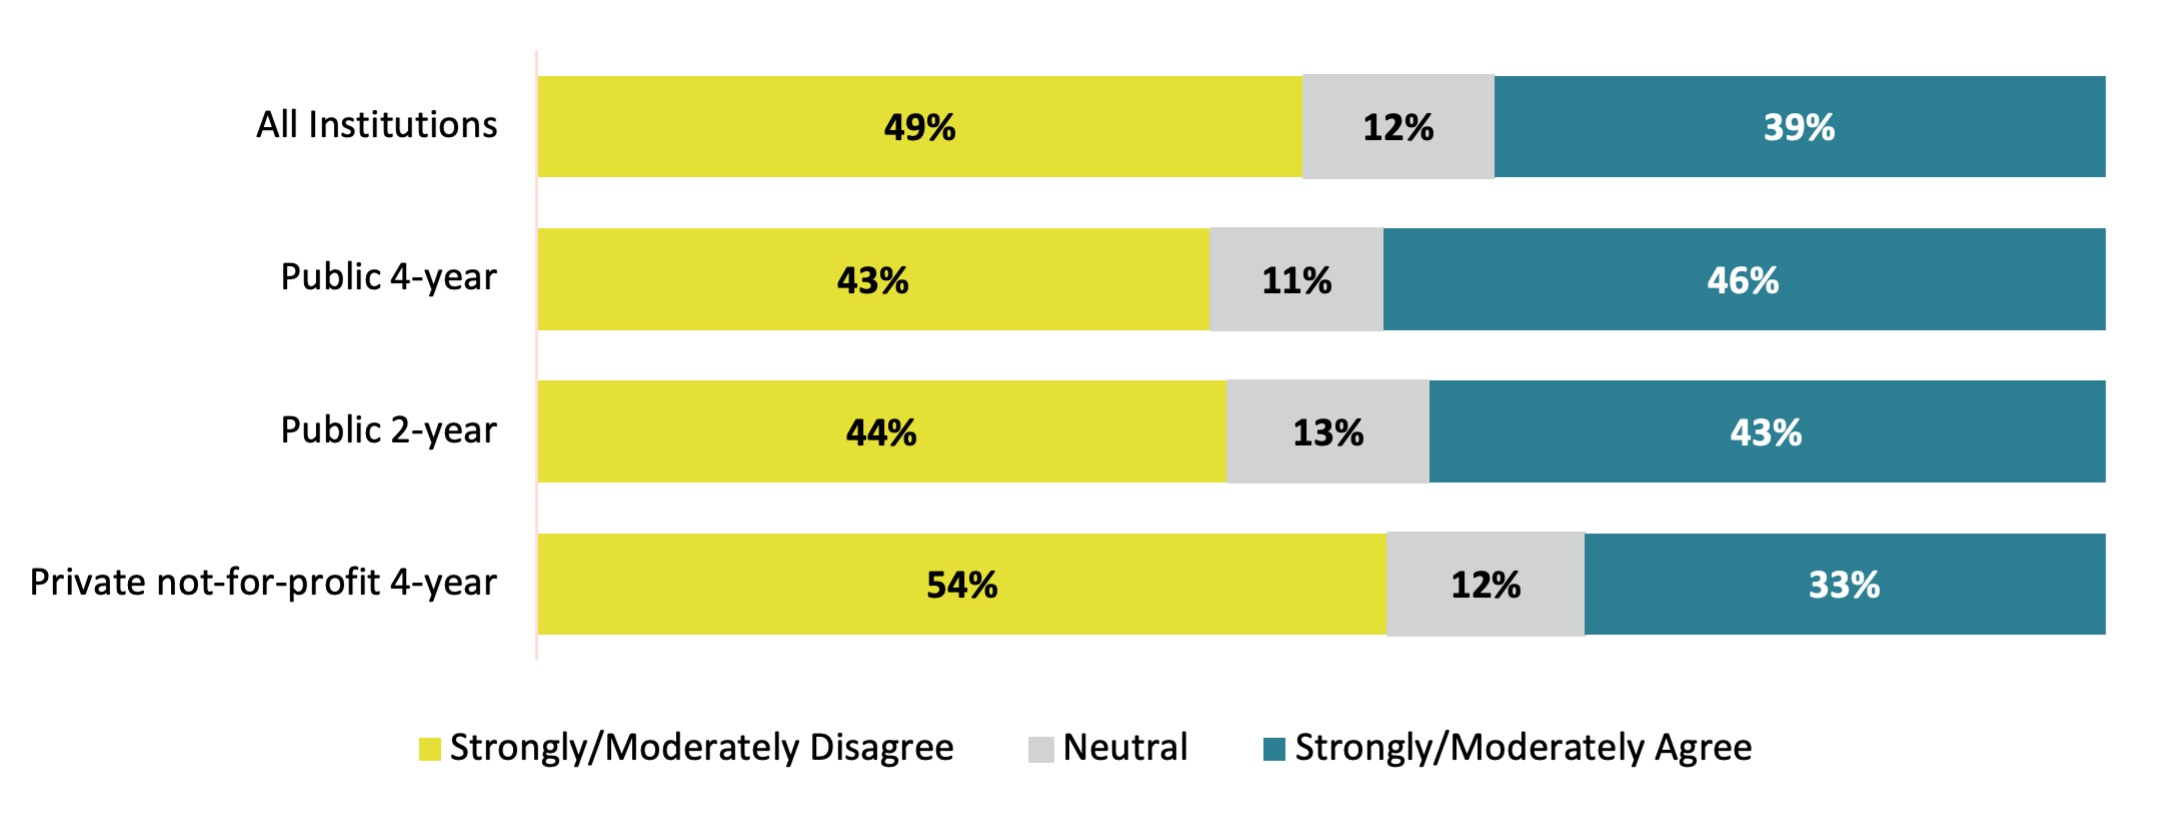
We asked office leaders to indicate their levels of agreement with the statement, “Office staffing is adequate to meet institutional expectations.” Respondents were almost evenly split on whether they believed their office staffs were adequate to meet institutional expectations (Chart 3).
Chart 3. IR Office Leader's Evaluation of Adequate Staff Size

When asked what their staff sizes need to be to meet current demand, office leaders responded that, on average, 4.8 FTE would be ideal. Comparing that to the actual values, we find that IR offices need approximately 1 full-time and 1 part-time additional staff to meet current demands. Those additional staff are needed across all three major sectors (Table 4).
| FTE Type | All Institutions | Public 4-year | Public 2-year | Private NFP 4-year |
|---|---|---|---|---|
| Ideal Staff FTE | 4.8 | 7.3 | 3.9 | 3.7 |
| Actual Staff FTE | 3.5 | 5.8 | 2.8 | 2.4 |
| Difference | 1.3 | 1.5 | 1.1 | 1.3 |
Changes in Staff FTE from 2015 to 2021
Of the 520 IR offices that are included in these analyses, 176 provided staff FTE data for all three editions of the National Survey of IR Offices (2015, 2018, and 2021). The results in this section are based on those 176 institutions.
In aggregate, there was a gain of one-tenth (0.1) staff FTE between 2015 and 2021. However, there are large differences by sector. On average, public 4-year institutions gained 1.7 staff FTE between 2015 and 2018, then had a slight decline between 2018 and 2021 (Table 5). IR offices in the other two sectors (public 2-year and private not-for-profit 4-year) lost approximately 0.5 FTE between 2015 and 2018, then had another, smaller, decline between 2018 and 2021.
| Institution Type | 2021 | 2018 | 2015 | Difference 2021: 2015 |
|---|---|---|---|---|
All Institutions | 4.1 | 4.2 | 4.0 | 0.1 |
Public 4-year | 6.4 | 6.5 | 4.8 | 1.6 |
Public 2-year | 3.0 | 3.2 | 3.8 | -0.8 |
Private NFP 4-year | 2.7 | 2.8 | 3.4 | -0.7 |
Demographic Profile of Office Staff
In addition to exploring staff roles and FTE, we also wanted to understand the gender and race/ethnicity profile of IR office staff. Table 6 reports the percentage of the average IR office by gender identity disaggregated by institutional sector. In aggregate, 58% of the IR office staff included in this survey, as reported by the IR office leaders, identify as female and 37% identify as male; there are some differences in those percentages by sector.
| Gender Identity | All Institutions | Public 4-year | Public 2-year | Private NFP 4-year |
|---|---|---|---|---|
| Identify as women | 57.3% | 59.8% | 61.2% | 53.6% |
| Identify as men | 35.7% | 33.1% | 35.8% | 37.8% |
| Identify as an option not provided in the survey | 3.8% | 4.4% | 2.1% | 3.9% |
| Don't know/didn’t disclose gender identity | 2.4% | 2.6% | 0.0% | 3.3% |
| Identify as agender | 0.6% | 0.0% | 0.3% | 1.2% |
| Identify as genderqueer or non-binary | 0.3% | 0.1% | 0.6% | 0.2% |
Table 7 reports the percentage of the average IR office by race/ethnicity disaggregated by institutional sector. In aggregate, 81% of the average IR office is white, 12% are Asian, and 8% are African American or Black or Hispanic or Latino/a; there are some differences in those percentages by sector. Public 4-year institutions are slightly more diverse compared to the other two sectors.
| Race/Ethnicity | All Institutions | Public 4-year | Public 2-year | Private NFP 4-year |
|---|---|---|---|---|
| White | 68.3% | 64.2% | 71.4% | 72.3% |
| Asian | 9.8% | 10.2% | 6.3% | 11.4% |
| African American or Black | 6.5% | 6.4% | 8.0% | 5.8% |
| Hispanic or Latino/a | 6.3% | 8.1% | 4.2% | 5.1% |
| Don't know/did not disclose ethnicity | 5.5% | 7.5% | 4.5% | 3.3% |
| Other/Option not given | 1.6% | 1.5% | 2.7% | 1.2% |
| Bi/Multiracial | 1.4% | 1.6% | 2.1% | 0.5% |
| American Indian or Alaska Native | 0.5% | 0.5% | 0.9% | 0.2% |
| Native Hawaiian or Other Pacific Islander | 0.1% | 0.0% | 0.0% | 0.2% |
Evaluation of Staff
In the National Survey, we asked office leaders to evaluate their staff on several metrics. Overwhelmingly, office leaders view their staff as ethical, independent, and effective employees who employ good interpersonal relationship skills (Table 8). While strong overall, there is room for improvement in teamwork and serving as institutional experts in the field of data and analytics.
| Statement | Strongly / moderately disagree | Neutral | Strongly / moderately agree |
|---|---|---|---|
| Staff adhere to standards dictating ethical use of data | 0% | 1% | 99% |
| Staff work well individually | 1% | 3% | 97% |
| Staff employ good interpersonal relationship skills | 2% | 3% | 96% |
| Staff work to build relationships across the institution | 1% | 5% | 94% |
| Staff work effectively | 1% | 5% | 94% |
| Staff effectively communicate results of their work | 2% | 7% | 92% |
| Staff work efficiently | 3% | 6% | 91% |
| Staff have appropriate educational background and/or training to perform their work | 3% | 7% | 90% |
| Staff continually work to improve their knowledge/skills | 2% | 9% | 89% |
| Staff work together as a team | 1% | 11% | 88% |
| Staff serve as institutional experts in data and analytics | 3% | 9% | 88% |
Methodology
The 2021 AIR National Survey of IR Offices attempted to survey IR office leaders at more than 3,000 postsecondary degree-granting institutions. Institutions of all sectors, types of control, and sizes were included in the sample. In total, responses were collected from 1,142 institutions, and 554 of those institutions completed the survey in full. To ensure comparable results, incomplete responses are excluded from this report. In addition, responses from for-profit institutions, administrative units, international institutions, private not-for-profit 2-year institutions, and institutions in U.S. territories are excluded due to low response rates.
The findings presented in this report are based on 520 responses that represent U.S. postsecondary, degree-granting institutions at public 4-year (146 institutions), public 2-year (125 institutions), or private not-for-profit 4-year institutions (249 institutions).
Suggested Citation
Jones, D., Keller, C., & Raza, Z. (2022). 2021 AIR National Survey of IR Offices: IR Office Staff Roles [Report]. Association for Institutional Research. www.airweb.org/NationalSurvey.
1. Analytical staff are employees whose primary responsibilities are analyses and reporting. Technical staff are employees whose primary responsibilities are technical tasks, such as software programming and database management.
2. See methodology section at end of this report for more information.
Related Content
2021 AIR National Survey of IR Offices: Topic Briefs
AIR National Survey of IR Offices
Long Description
Chart 1. Average FTE by Staff Role
Chart 1 is a bar chart showing the average FTEs of specific staff roles. Numerical values presented on the image:
| Staff Role | FTE |
|---|---|
| Office Leader | 1.0 |
| Associate/Assistant Directors | 1.5 |
| Senior Analytical Staff | 1.4 |
| Analytical Staff | 2.0 |
| Technical Staff | 1.8 |
| Administrative Support Staff | 0.9 |
Chart 2. Relationship between IR Office Staff FTE and Student FTE Enrollment
Chart 2 is a bar chart showing average IR office staff FTE by sector overlaid with the average student FTE enrollment in aggregate for the three major sectors. Numerical values presented on the image:
| Sector | Average Staff FTE | Average Student FTE Enrollment |
|---|---|---|
| Aggregate | 3.5 | 6,393 |
| Public 4-year | 5.8 | 13,241 |
| Public 2-year | 2.8 | 3,846 |
| Private NFP 4-year | 2.4 | 3,656 |
Chart 3. IR Office Leader's Evaluation of Adequate Staff Size
Chart 3 is a bar chart showing levels of agreement with the statement, “Office staffing is adequate to meet institutional expectations.”. Numerical values presented on the image:
| Level of Agreement | Private not-for-profit 4-year | Public 2-year | Public 4-year | All Institutions |
|---|---|---|---|---|
| Strongly/Moderately Disagree | 54% | 44% | 43% | 49% |
| Neutral | 12% | 13% | 11% | 12% |
| Strongly/Moderately Agree | 33% | 43% | 46% | 39% |
