
IR Office Staff Job Functions and Salary Expenditures
This brief is one of a series of reports. Learn more at airweb.org/nationalsurvey.
An effective institutional research (IR) office leader understands the need to manage the amount of staff time devoted to various job functions to meet stakeholders’ expectations and to achieve goals. The 2021 AIR National Survey of IR Offices explored time spent on specific types of work and the associated staff salary expenses.
Time Spent on Job Functions by Staff Role
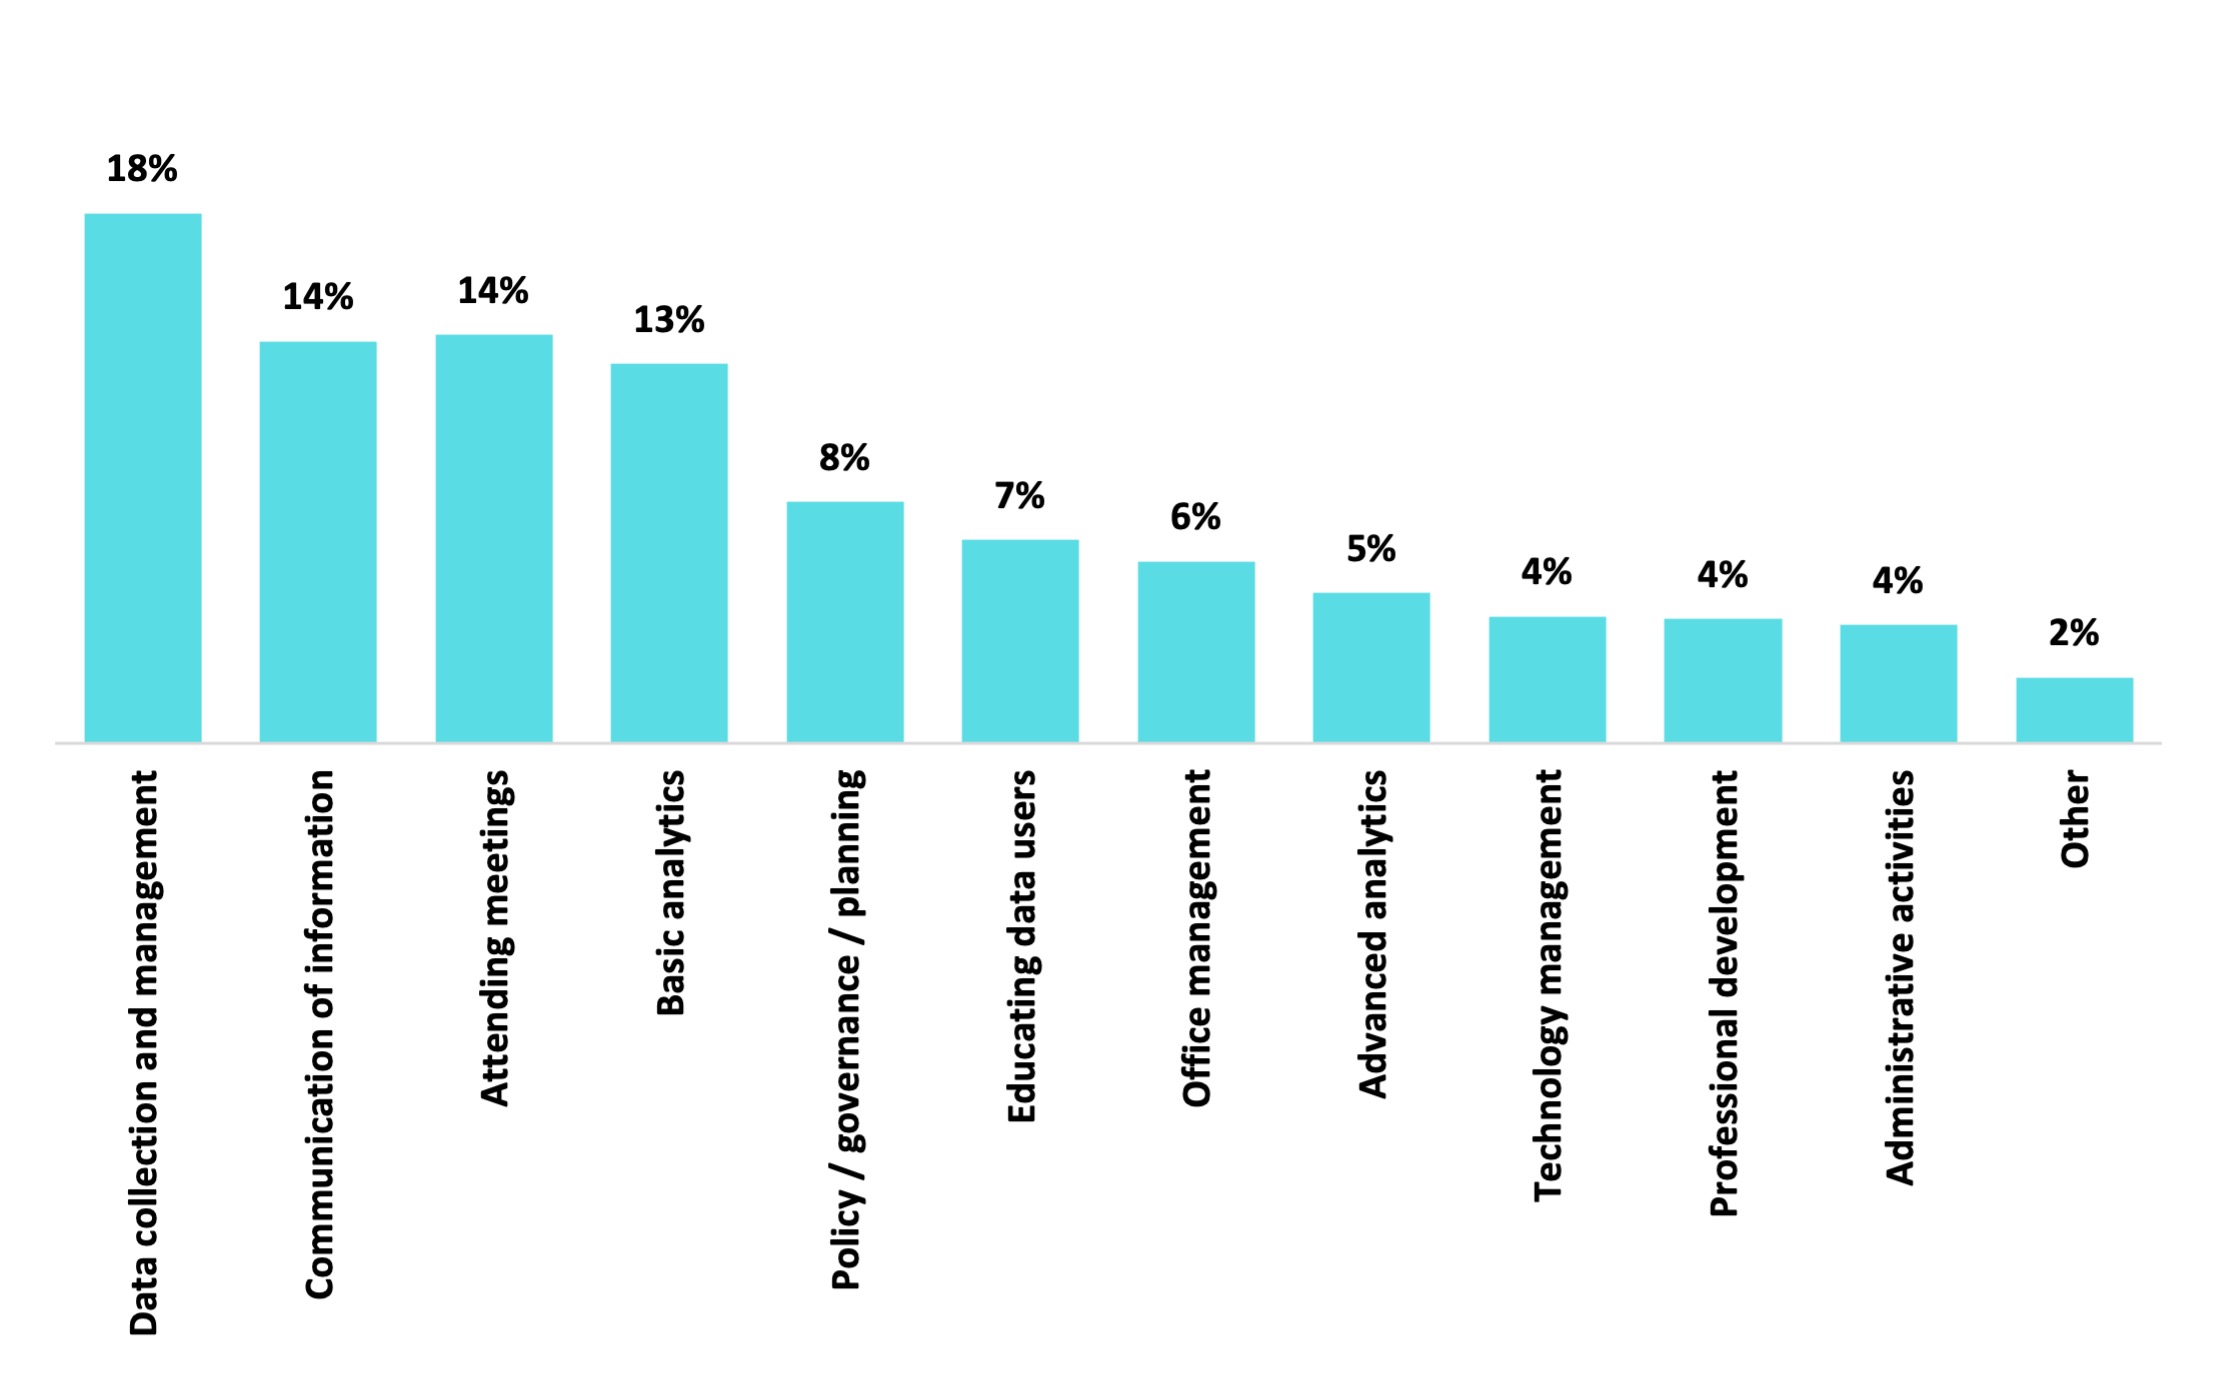
We asked IR office leaders to estimate the percentage of time they devote to daily job functions. More than half of their time (59%) is spent performing data collection and management, communicating information, attending meetings, and conducting basic analyses (Chart 1).
Chart 1. Percentage of IR Office Leader Time Spent by Job Functions
When we disaggregate these data by major institutional sector (i.e., public 4-year, public 2-year, and private not-for-profit 4-year institutions), we find slight differences (Table 1). For example, IR office leaders at private not-for-profit 4-year institutions spend more time in data collection and management compared to their public sector colleagues.
| Job Function | All Institutions | Public 4-year | Public 2-year | Private NFP 4-year |
|---|---|---|---|---|
| Data collection and management | 18% | 14% | 19% | 21% |
| Basic analytics | 14% | 14% | 13% | 14% |
| Communication of information | 14% | 16% | 15% | 13% |
| Attending meetings | 13% | 12% | 14% | 13% |
| Educating data users | 8% | 8% | 9% | 8% |
| Policy/governance/planning | 7% | 7% | 6% | 7% |
| Advanced analytics | 6% | 8% | 6% | 5% |
| Office management | 5% | 6% | 4% | 5% |
| Administrative activities | 4% | 4% | 4% | 4% |
| Professional development | 4% | 4% | 5% | 4% |
| Technology management | 4% | 4% | 4% | 4% |
| Other | 2% | 2% | 2% | 2% |
We also asked IR office leaders to estimate the percentage of time spent on various job functions by staff role (Table 2). Five out of the six staff roles spend the largest amount of time on data collection and management while administrative support staff spend their largest segment of time (32%) on administrative activities.
| Job Function | Office leader | Asst/ Assoc Directors | Senior Analytical staff | Analytical staff | Technical staff | Admin Support staff | Student staff |
|---|---|---|---|---|---|---|---|
| Data collection and mgmt | 18% | 23% | 26% | 30% | 28% | 17% | 33% |
| Basic analytics | 13% | 16% | 20% | 22% | 12% | 6% | 30% |
| Advanced analytics | 5% | 6% | 9% | 5% | 3% | 0% | 4% |
| Communicating information | 14% | 13% | 12% | 12% | 10% | 9% | 14% |
| Educating data users | 7% | 7% | 6% | 6% | 6% | 3% | 1% |
| Technology management | 4% | 7% | 7% | 5% | 22% | 2% | 2% |
| Professional development | 4% | 6% | 5% | 6% | 6% | 5% | 2% |
| Office management | 6% | 4% | 1% | 1% | 1% | 14% | 1% |
| Attending meetings | 14% | 9% | 7% | 7% | 7% | 7% | 3% |
| Policy/governance/planning | 8% | 4% | 3% | 2% | 2% | 1% | 0% |
| Administrative activities | 4% | 3% | 1% | 2% | 1% | 32% | 4% |
| Other | 2% | 2% | 1% | 2% | 0% | 4% | 6% |
Annual Full-time Staff Salary Cost per Job Function
Staff compensation is typically one of the largest expenses an IR office incurs. As such, it is important to understand how staff spend their time and how that time translates to salary expenditures. Awareness of staff compensation costs associated with specific job functions informs capacity and budget decisions and contributes to more efficient and effective stewardship of institutional resources.
Table 3 reports the average annual full-time salary expenses for the IR office.
| Staff Role | Average Annual Full-time Salary* | Average FTE** | Average Annual Full-time Salary Expenses*** |
|---|---|---|---|
| Office leader | $100,308 | 1.0 | $99,505 |
| Assistant/Associate Directors | $81,853 | 0.4 | $36,332 |
| Senior Analytical Staff | $74,469 | 0.4 | $31,521 |
| Analytical Staff | $61,539 | 1.0 | $64,512 |
| Technical Staff | $66,331 | 0.3 | $16,855 |
| Administrative Support Staff | $46,183 | 0.2 | $8,988 |
| TOTAL | 3.3 | $257,712 |
*Data reported in the 2021 AIR National Survey of IR Offices: IR Office Full-time Staff Salaries
**Data reported in the 2021 AIR National Survey of IR Offices: IR Office Staff Roles
***Salary expenses per staff role were calculated by multiplying the average annual salary by the average full-time equivalent (FTE) for each staff role.
Using the data reported in Table 3, we can calculate the average salary expenses associated with each job function (Chart 2). We found that the average IR office spends over $100,000 in staff salaries in data collection, data management, and conducting basic analyses. An additional $32,000 is spent in staff salaries communicating information.
Chart 2. Annual IR Office Salary Expense by Job Function
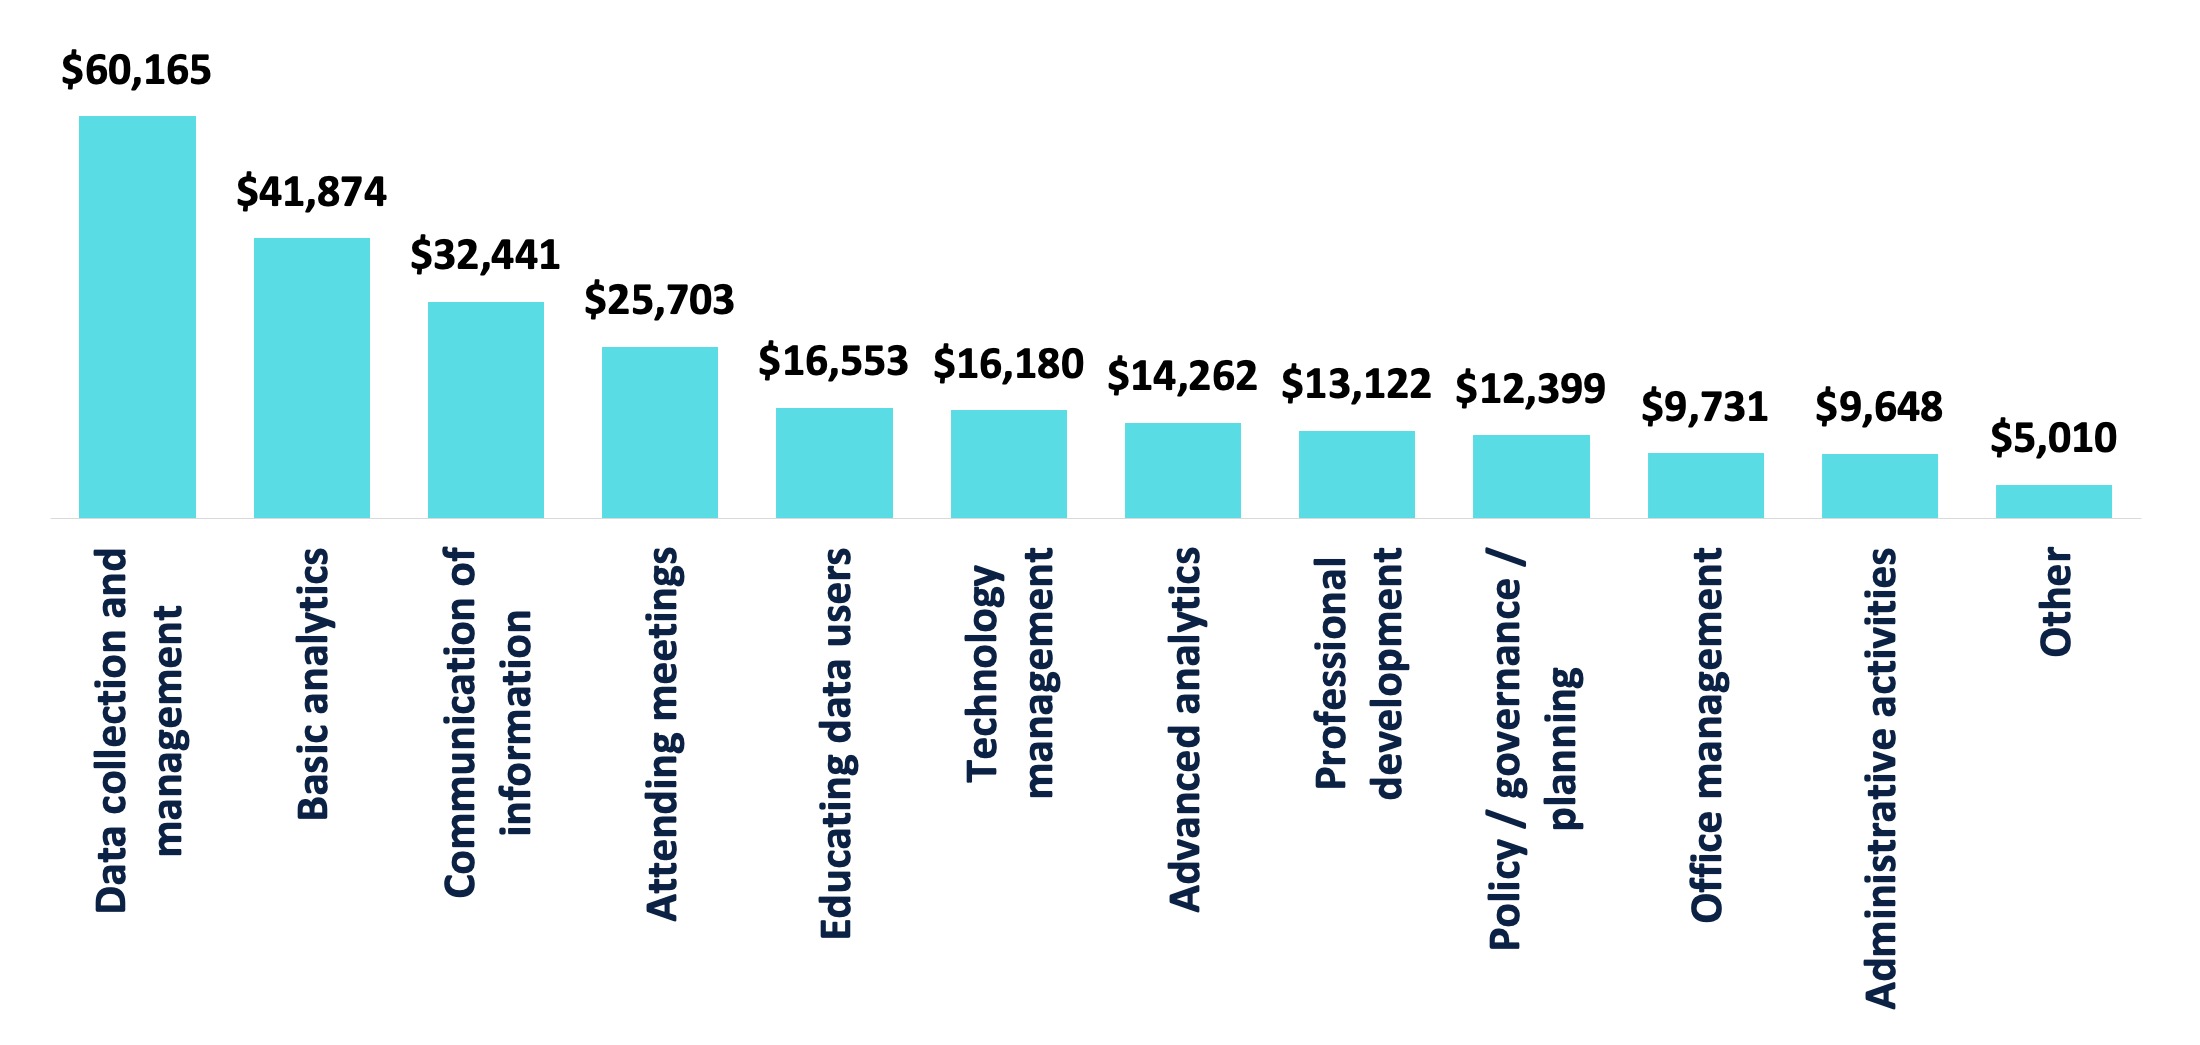
Note: Salary expenses were calculated by multiplying the percentage of time spent on various job functions by staff role in Table 2 with the average salary expenses in Table 3.
In Table 4, we provide a breakdown of the average, full-time salary expenses associated with each job function for each staff role. The average IR office dedicates more than $18,000 of the leader’s salary to data collection and management and nearly $13,000 to basic analytics.
| Staff Role | All Roles | Office leader | Asst / Assoc | Sr Analysts | Analysts | Tech Staff | Admin Support Staff |
|---|---|---|---|---|---|---|---|
| Data collection and management | $60,165 | $18,015 | $8,478 | $8,128 | $19,263 | $4,772 | $1,508 |
| Basic analytics | $41,874 | $12,896 | $5,699 | $6,272 | $14,401 | $2,036 | $570 |
| Advanced analytics | $14,262 | $5,106 | $2,268 | $2,979 | $3,379 | $501 | $29 |
| Communication of information | $32,441 | $13,660 | $4,565 | $3,878 | $7,825 | $1,663 | $851 |
| Educating data users | $16,553 | $6,903 | $2,621 | $2,021 | $3,722 | $988 | $297 |
| Technology management | $16,180 | $4,317 | $2,636 | $2,070 | $3,284 | $3,719 | $154 |
| Professional development | $13,122 | $4,227 | $2,107 | $1,710 | $3,664 | $1,007 | $407 |
| Office management | $9,731 | $6,181 | $1,336 | $346 | $478 | $175 | $1,215 |
| Attending meetings | $25,703 | $13,881 | $3,414 | $2,324 | $4,379 | $1,116 | $589 |
| Policy/governance/ planning | $12,399 | $8,211 | $1,583 | $874 | $1,313 | $285 | $133 |
| Administrative activities | $9,648 | $4,022 | $1,041 | $468 | $1,021 | $194 | $2,902 |
| Other | $5,010 | $2,233 | $634 | $451 | $1,306 | $57 | $328 |
Following the same logic, we calculated the average salary expenses per job function by major institutional sector (Table 5). IR offices at public 4-year institutions allocate over $95,000 to staff salaries to collect and manage data, and nearly $77,000 for basic analytics; those values are significantly higher than the other two sectors’ expenditures.
| Institutional Sector | All Institutions | Public 4-year | Public 2-year | Private NFP 4-year |
|---|---|---|---|---|
| Data collection and management | $60,165 | $95,248 | $46,848 | $45,264 |
| Basic analytics | $41,874 | $76,890 | $34,300 | $27,013 |
| Advanced analytics | $14,262 | $27,970 | $10,133 | $9,684 |
| Communication of information | $32,441 | $56,317 | $24,878 | $23,471 |
| Educating data users | $16,553 | $30,092 | $13,481 | $11,185 |
| Technology management | $16,180 | $32,051 | $13,462 | $9,081 |
| Professional development | $13,122 | $23,721 | $12,239 | $7,942 |
| Office management | $9,731 | $18,900 | $8,171 | $6,306 |
| Attending meetings | $25,703 | $44,432 | $23,853 | $17,362 |
| Policy/governance/planning | $12,399 | $18,873 | $11,589 | $9,622 |
| Administrative activities | $9,648 | $15,538 | $10,046 | $6,531 |
| Other | $5,010 | $6,958 | $4,636 | $4,190 |
These findings highlight key considerations for the ways in which staff time and salaries are allocated, including time and capacity by role, and salary levels by job functions and activities. The goal of providing this information is to establish a foundation for IR offices to explore salary and job function data and inform conversations about the way responsibilities are assigned, goals are designed and pursued, and whether internal and external solutions are (or could be) employed (e.g., software, outsourcing, collaboration with other institutional units).
Average Hours Worked per Week by Role
We asked office leaders to indicate the average number of hours worked by their IR office staff by role. We found that most full-time IR office staff work approximately 40 hours per week regardless of role but some work longer hours. Table 6 shows the percentage of IR offices whose staff work 50 or more hours per week, on average, disaggregated by sector. We found that one-fourth of office leaders work, on average, 50 or more hours a week. We also found that a higher percentage of IR office staff at public 4-year institutions, regardless of role, average 50 or more hours worked per week compared to staff at the other two sectors.
| Full-time Staff Working 50+ Hours per Week, on Average | All Institutions | Public 4-year | Public 2-year | Private NFP 4-year |
|---|---|---|---|---|
| Office Leader | 28% | 37% | 24% | 23% |
| Associate/Assistant Directors | 13% | 16% | 6% | 10% |
| Senior Analytical Staff | 8% | 11% | 10% | 3% |
| Analytical Staff | 2% | 2% | 2% | 4% |
| Technical Staff | 6% | 9% | 7% | 0% |
NOTE: Too few administrative support staff average 50 or more hours per week to make analyses credible.
Remote Work Options
The COVID-19 pandemic caused higher education institutions to require some, if not all, staff to work remotely. We asked office leaders if remote work was continuing for their offices.
We learned that 86% of IR offices allow some form of remote work; 18% are completely remote (Table 7). However, that varied by sector. IR offices at public 2-year institutions were less likely to allow remote work while offices at private not-for-profit 4-year institutions were more likely to offer remote work.
| Statement | All Institutions | Public 4-year | Public 2-year | Private NFP 4-year |
|---|---|---|---|---|
| Staff can work remotely every day | 18% | 18% | 14% | 20% |
| Staff can work remotely for part of the week (1-4 days) | 32% | 27% | 28% | 37% |
| Staff can work remotely under specific circumstances | 34% | 37% | 34% | 33% |
| Some can work remotely; others must work in the office | 1% | 2% | 1% | 1% |
| No remote work options | 14% | 16% | 23% | 8% |
We also asked office leaders if they believed these remote work options would change in the next year and found that 48% said their current remote options would remain the same, 16% said their remote work options would change, and the remaining 36% were unsure.
Methodology
The 2021 AIR National Survey of IR Offices attempted to survey IR office leaders at more than 3,000 postsecondary degree-granting institutions. Institutions of all sectors, types of control, and sizes were included in the sample. In total, responses were collected from 1,142 institutions, and 554 of those institutions completed the survey in full. To ensure comparable results, incomplete responses are excluded from this report. In addition, responses from for-profit institutions, administrative units, international institutions, private not-for-profit 2-year institutions, and institutions in U.S. territories are excluded due to low response rates.
The findings presented in this report are based on 520 responses that represent U.S. postsecondary, degree-granting institutions at public 4-year (146 institutions), public 2-year (125 institutions), or private not-for-profit 4-year institutions (249 institutions).
Suggested Citation
Jones, D., Keller, C., & Raza, Z. (2022). 2021 AIR National Survey of IR Offices: IR Office Full-time Staff Salaries [Report]. Association for Institutional Research. www.airweb.org/NationalSurvey.
Related Content
2021 AIR National Survey of IR Offices: Topic Briefs
AIR National Survey of IR Offices
Long Description
Chart 1. Percentage of IR Office Leader Time Spent by Job Functions
Chart 1 is a bar chart displaying percent of time spent by job function. Numerical values presented on the image:
| Job Function | Time Spent |
|---|---|
| Data collection and management | 18% |
| Communication of information | 14% |
| Attending meetings | 14% |
| Basic analytics | 13% |
| Policy / governance / planning | 8% |
| Educating data users | 7% |
| Office management | 6% |
| Advanced analytics | 5% |
| Technology management | 4% |
| Professional development | 4% |
| Administrative activities | 4% |
| Other | 2% |
Chart 2. Annual IR Office Salary Expense by Job Function
Chart 2 is a bar chart showing calculated average salary expenses associated with various job functions. Numerical values presented on the image:
| Job Function | TOTAL |
|---|---|
| Data collection and management | $60,165 |
| Basic analytics | $41,874 |
| Communication of information | $32,441 |
| Attending meetings | $25,703 |
| Educating data users | $16,553 |
| Technology management | $16,180 |
| Advanced analytics | $14,262 |
| Professional development | $13,122 |
| Policy / governance / planning | $12,399 |
| Office management | $9,731 |
| Administrative activities | $9,648 |
| Other | $5,010 |