Bottleneck Capacity Courses Dashboard
Humboldt State University (HSU) is one of 23 campuses in the nation’s largest four-year university system, the California State University (CSU) system. The CSU Chancellor’s Office has broadly described a bottleneck course as a course that may limit students’ ability to make progress toward graduation. Blanchard, Hanley, & Sullivan (2016) identified five causes of bottleneck courses, two of which HSU is actively working to reduce.
- Bottleneck Course – Capacity: Seating capacity
- Bottleneck Course – Success: High failure rates
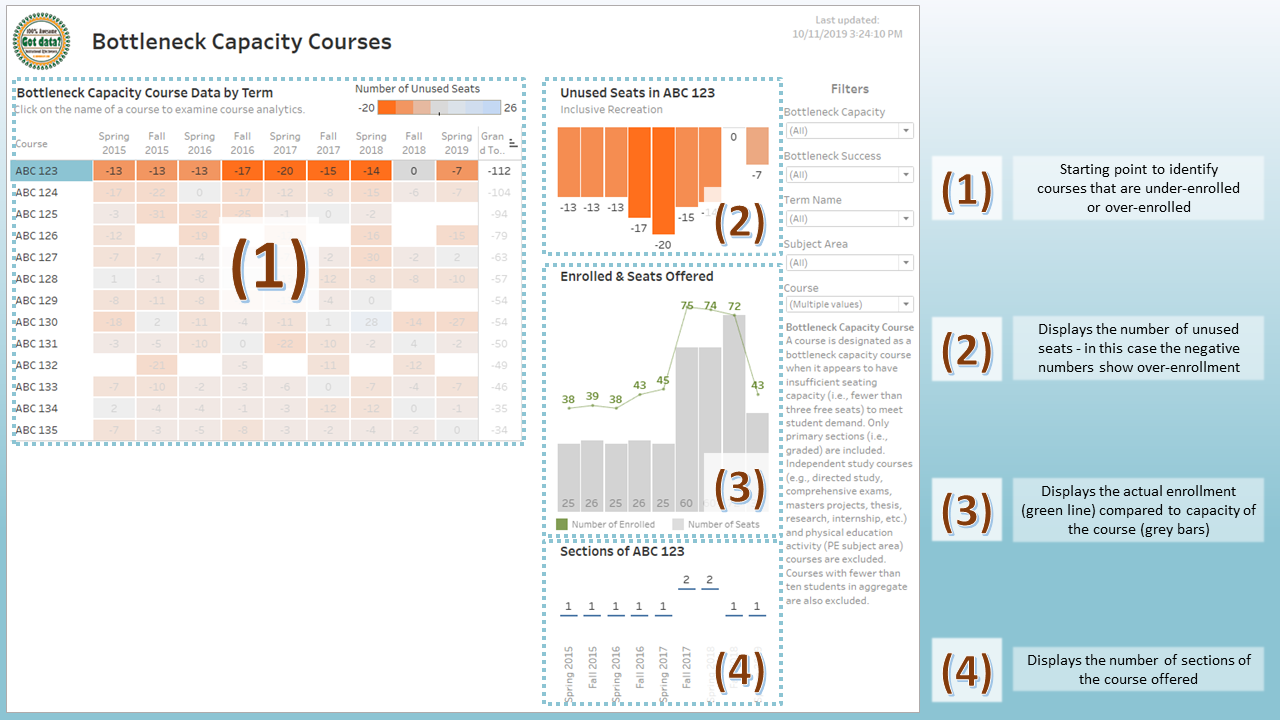
In this example of the Bottleneck Course – Capacity, there are four steps to investigating roadblocks:
- Starting point to identify courses that are under-enrolled or over-enrolled
- Displays the number of unused seats – in this case, the negative numbers show over-enrollment
- Displays the actual enrollment (green line) compared to the capacity of the course (grey bars)
- Displays the number of sections of the course offered

In some cases, it is not all the data needed to act, but it is enough to quickly sort all courses offered in the last four years and examine them for a possible roadblock.
This visual was created in Tableau software. See the full visual (PDF) here.
