A Three-part Series on the Application and Production of Shiny Applications for IR: Part 1
This is Part 1 of a three-part series (see Part 2 and Part 3) that provides a friendly introduction to Shiny for institutional research (IR) professionals through examples and references to available learning resources. Part 1 will discuss the potential benefits of Shiny in the IR space and spotlight a few known applications of Shiny web applications in higher education; Part 2 provides an overview of the main components of a Shiny application and an accessible demonstration of building a Shiny application to perform statistical analysis of equity and inclusion in science courses; and Part 3 presents a list of available learning resources covering some advanced topics and will highlight one known challenge for Shiny adoption at higher education institutions, providing a call for IR, IT, and data security staff to work together to develop solutions to facilitate the diffusion of analytics across our campuses.
It is important to note that this series focuses on Shiny web applications in the context of an IR office that currently uses or has interest in using the R programming language. Shiny web applications can also be built using the Python programming language, but this is not covered in the series. Various resources are available online for using Python to create web applications (including the Shiny (posit.co) website).
What is Shiny and What are its Potential Benefits for IR?
R is a free, open-source programming language geared toward data manipulation, mathematical computation, and statistical analysis. Shiny is an R package that provides a framework for building web applications and interactive data-driven dashboards using R. Thus, as an extension package in R, Shiny allows you to combine the statistical, analytical capabilities of R with the display and interactive abilities of a web page (Shiny - RStudio). For IR offices that utilize R, this fusion of interactivity and statistical analysis provides a powerful opportunity for imbedding analytics into the data products that our offices create. Such examples of imbedded analytics could take the form of:
- Internal IR tools that streamline processes and complement existing data deliverables.
- Example: A self-service data tool that checks for statistical significance based on selected outcome variables and student subgroups. Such information could be used by IR staff to create quick executive summary reports that present outcome trends and differences in the context of statistical significance.
- Stakeholder dashboards that generate insights from analytics on the fly.
- Example: A dashboard that allows users to interact with a machine learning model by toggling and changing input thresholds to test various what-if scenarios and their potential impact. Such information could help stakeholders develop a data-informed strategy for how they can best invest campus resources to achieve a desired campus goal (increase student retention, increase admissions yield, decrease costs, etc.).
These examples highlight a benefit that Shiny can yield over software tools such as Tableau and PowerBI. While Tableau and PowerBI allow rich potential for filtering and interacting with data, these tools currently supply limited capabilities for statistical analysis beyond fitting trend lines and conducting basic correlation analyses. Since Shiny applications are created entirely with R code, any statistical or analytical methods available through R (or extension packages of R) can be leveraged to build web applications without additional knowledge of html or JavaScript. As our campuses are faced with reduced budgets and limited staff resources, the need for multi-purposed software tools is paramount. Finally, R and R Shiny are tools that can be supported by cloud environments such as AWS and other environments or servers. With the increased use of cloud-based data repositories in higher education, developing with R Shiny has the potential to take advantage of greater computing resources.
Example Shiny Applications in Higher Education
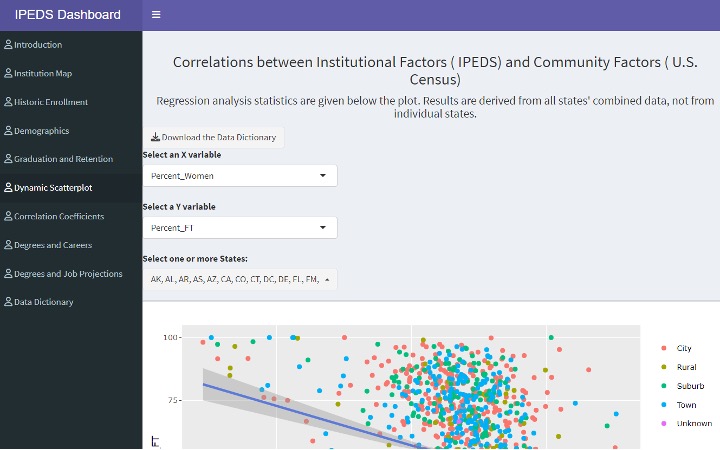
While Shiny usage in higher education is generally still a novel concept, there are several scenarios in the field that showcase its value. As one example, professors in the School of Education at the University of Wyoming created an R Shiny dashboard for university stakeholders that compiles publicly available data from the Integrated Postsecondary Education Data System (IPEDS), the U.S. Census Bureau, and the U.S. Bureau of Labor Statistics. The dashboard provides data visualizations and models that allow administrators “to project career and wage outcomes that inform adjustments to academic programs [and] identify enrollment trends to improve recruitment efforts and better allocate resources.” A summary of the project is provided in a news article, and the project yielded a peer-reviewed publication that includes the R Code that produced the Shiny dashboard. An image of the dashboard is shown in Figure 1 alongside a direct link to the project.
Figure 1: IPEDS R Shiny Dashboard Created by University of Wyoming
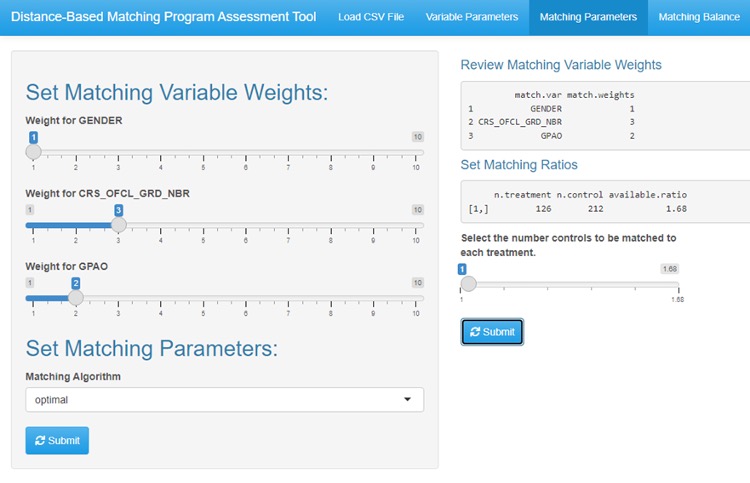
IR staff in the Office of Institutional Analytics at Indiana University have been using Shiny to support advanced analytics, for example, a Shiny application that is used internally to create matched comparison groups for the purpose of improving campus programs and instruction. The Shiny application allows a user to upload a csv file, select variables that are to be used to create the matched comparison group, set various parameters to define the matching process (weights, matching algorithm type, etc.), and download a resulting matched dataset that can be used for program evaluation analyses on campus. A peer-reviewed publication (see pp. 41-44: A Rapid Approach to Learning Analytics: A Distance-Based Matching Program Assessment Tool) describes the tool in more detail, and user guides and R code for the tool are downloadable from a public GitHub repository. Figure 2 provides an image of the tool. This university also created another Shiny application to assist campus stakeholders with selecting peer institutions. The web application contained a data set with many IPEDS variables of interest. Administrative staff could select which variables they wanted to use to identify similar institutions and set weights for each of those variables to reflect the importance of each variable for defining peers. The application would take the variable list and weights as selected by the user, compute a distance score based on those selections, and present a list of which institutions were the most similar based on that distance score.
Figure 2: Distance-Based Matching Program Assessment Tool by Indiana University
Stay Tuned for Part Two
This concludes the first part of our three-part series on the application and production of Shiny applications in IR. In Part 2, we introduce the components of a Shiny application and dive into some accessible examples of how to build a Shiny app.
 Gina Deom has nearly 10 years of experience working in higher education data and research. She currently serves as a data scientist with the Research and Analytics team, a subunit within Indiana University’s Institutional Analytics office. Gina has given several presentations at national and international conferences, including the SHEEO Higher Education Policy Conference, the NCES STATS-DC Data Conference, the Learning Analytics and Knowledge (LAK) Conference, and the AIR Forum. Gina has earned a best paper award from INAIR, AIR, and LAK.
 Jesse Talley has over seven years working in higher education data and research, including four years in institutional research and three years in survey research and administration. He currently serves as a data analyst at Indiana University’s
Institutional Analytics office. Jesse has collaborated on previous conference presentations for the AIR, INAIR, the American Association of Public Opinion Research, and the Midwest Association for Public Opinion Research. He also contributed a
methodological report for an NSF project, portions of which were published in a peer-reviewed journal.
Jesse Talley has over seven years working in higher education data and research, including four years in institutional research and three years in survey research and administration. He currently serves as a data analyst at Indiana University’s
Institutional Analytics office. Jesse has collaborated on previous conference presentations for the AIR, INAIR, the American Association of Public Opinion Research, and the Midwest Association for Public Opinion Research. He also contributed a
methodological report for an NSF project, portions of which were published in a peer-reviewed journal.
 Michael Sauer is Lead Information Management Analyst for Research and Analytics at Indiana University. Mike began his career in institutional research at IU in 2002, and currently serves as an Information Analyst on the Research and Analytics team.
Prior to his time in institutional research, he taught Spanish and Portuguese at IU. He holds a Certificate in Underwater Resource Management from IU, is a certified yoga instructor and an Indiana Master Naturalist. He enjoys being with family,
reading, observing nature, watching IU sports and learning languages. Mike holds a Master of Public Affairs in Environmental Policy and Natural Resource Management, a Master’s in Latin American and Caribbean Studies (both from Indiana University),
and a Bachelor’s in History from the College of Wooster.
Michael Sauer is Lead Information Management Analyst for Research and Analytics at Indiana University. Mike began his career in institutional research at IU in 2002, and currently serves as an Information Analyst on the Research and Analytics team.
Prior to his time in institutional research, he taught Spanish and Portuguese at IU. He holds a Certificate in Underwater Resource Management from IU, is a certified yoga instructor and an Indiana Master Naturalist. He enjoys being with family,
reading, observing nature, watching IU sports and learning languages. Mike holds a Master of Public Affairs in Environmental Policy and Natural Resource Management, a Master’s in Latin American and Caribbean Studies (both from Indiana University),
and a Bachelor’s in History from the College of Wooster.
 Stefano Fiorini Ph.D. is a Social and Cultural Anthropologist with the Research and Analytics team, a subunit within Indiana University’s Institutional Analytics office. He has extensive applied research experience in the areas of institutional
research and learning analytics. He has published in peer reviewed journals and conference proceedings and presented at national and international conferences (e.g. AIR Annual Forum, CSRDE, LAK), earning best paper awards from INAIR, AIR and SoLAR.
Stefano Fiorini Ph.D. is a Social and Cultural Anthropologist with the Research and Analytics team, a subunit within Indiana University’s Institutional Analytics office. He has extensive applied research experience in the areas of institutional
research and learning analytics. He has published in peer reviewed journals and conference proceedings and presented at national and international conferences (e.g. AIR Annual Forum, CSRDE, LAK), earning best paper awards from INAIR, AIR and SoLAR.