Exploring Data Using Excel’s Power Query Editor
While I primarily use Microsoft Excel’s Power Query Editor to put together a complicated table or report in a short period of time, I’ve learned that you can also use it to explore any data set. Here are the steps you can take, and what features are available.
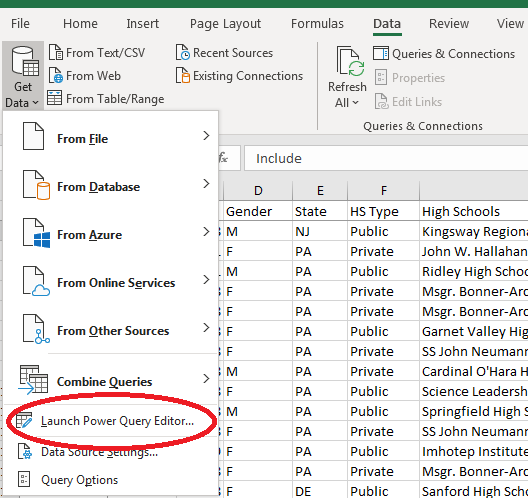
From the Data tab of Excel, click Data --> Launch Power Query Editor. This can be done in any spreadsheet.
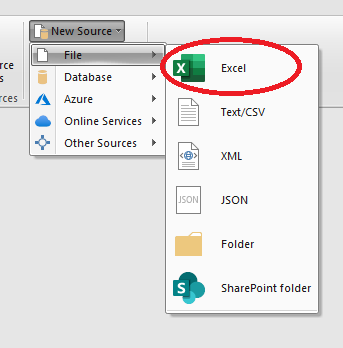
Using the Home tab in the Editor, select New Source --> Excel to pick the file and spreadsheet (tab) you wish to explore. This will be at the far right of the ribbon.
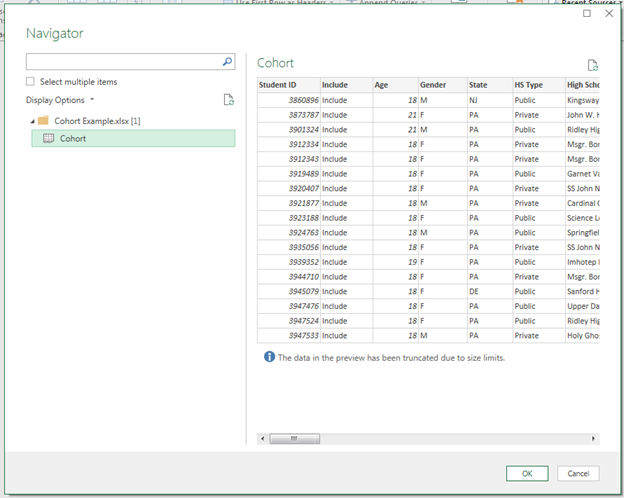
Here’s an example of what you will see when selecting your file of interest. Click OK to continue.
Go to the View tab. Click the checkboxes “Column distribution,” “Column profile,” and “Column quality” to enable the data summaries.
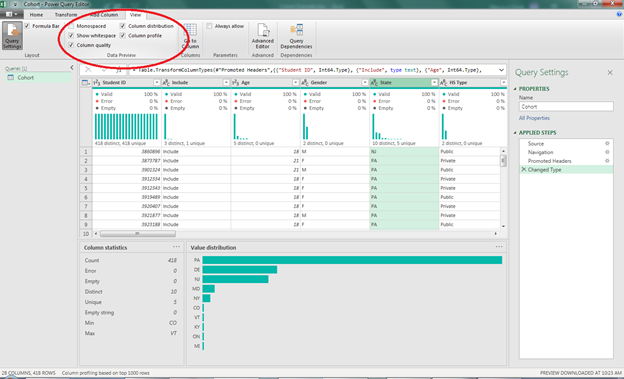
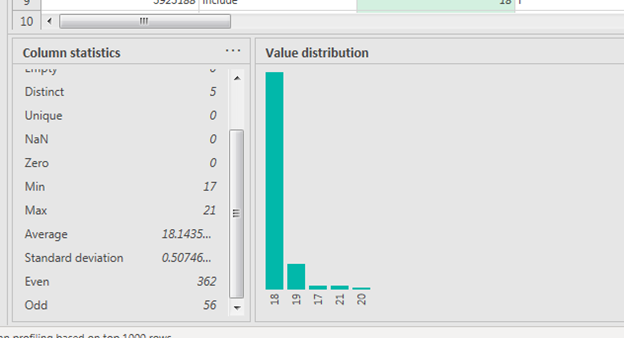
Column statistics and Value distributions will change based on the column you have selected. The above picture shows a summary provided for a text variable. For a numeric variable you get even more information, such as counts for Not a Number (NaN), Zero, Average, Standard Deviation, and Even or Odd. The three dots next to Column statistics will allow you to copy that table of data. The three dots next to Value distribution allow you to group your data by data values, sign (positive/negative), or parity (even/odd); and you can also filter the data. Unfortunately, there is no way to sort the value distribution in numerical order at this time.
When you’re done, you can close and discard changes if you have no need to continue working with the data set in Power Query. Feel free to contact me with any questions!


