Five Steps to Standardizing IPEDS Data Access at Your Institution
Introduction
This eAIR Tech Tip provides advice for institutional researchers who utilize Integrated Postsecondary Education Data System (IPEDS) data for benchmarking, look-back, market, and similar landscape analyses. With this tech tip, I hope to help promote reproducibility while saving institutional researchers valuable time.
Reproducibility
One of the many challenges associated with accessing IPEDS is that there are multiple available portals, websites, and application program interfaces (APIs). While the wide range of tools available for accessing IPEDS data promotes access, it can also complicate other important aspects of our work. For example, if two or more researchers set out to conduct an analysis in response to identical research questions, it is likely that each researcher will access the data in different ways. When different researchers access the same data, but in different ways, it may be more difficult for each researcher to match results.
Saving Time
Another challenge associated with compiling these data is that doing so via ‘point-and-click’ methods can be time-consuming. As I explained on YouTube, and in a related article, it took me 32 minutes to compile a panel of data comprising one IPEDS survey file repeated over six years. If I wanted a 12-year data panel of two survey files, we could extrapolate a time commitment exceeding 2 hours, 10 minutes, and 40 seconds.
The Solution
A solution that can help standardize data access, sourcing, cleaning, preparation, and related data management tasks is to write code that will do this work for you. There are multiple readily available languages suitable for the task. For example, this
GitHub repository shows how to do this work with Stata. I have previously written an article that shows how to accomplish this task with Python. Both resources further point to other examples that accomplish similar objectives with R code.
It may work well for institutional research professionals to work with their teams in order to establish a library of code that collects IPEDS (or other) data, cleans it, and prepares it for analysis. When everyone relies on data sourced with
a standardized tool it will be easier to promote reproducibility. Having a line-by-line record of how you retrieved and then manipulated the data will also promote confidence in the results.
The Five Step Process
The remainder of this article provides an abbreviated version of the information presented in an earlier article, Sourcing Federal Data: Higher Education Data, which puts together a three-year IPEDS data panel using Python. There are five steps associated with accomplishing this task via Python.
- Importing packages
- Getting the data
- Cleaning the data
- Saving the data
- Panel assembly
In the first step, importing packages, the code requires requests, which lets us download the raw data from online; zipfile, which lets us extract the files from their compressed zip archives; io, which lets us write the decompressed files to disk; and pandas, which is a popular data manipulation package.
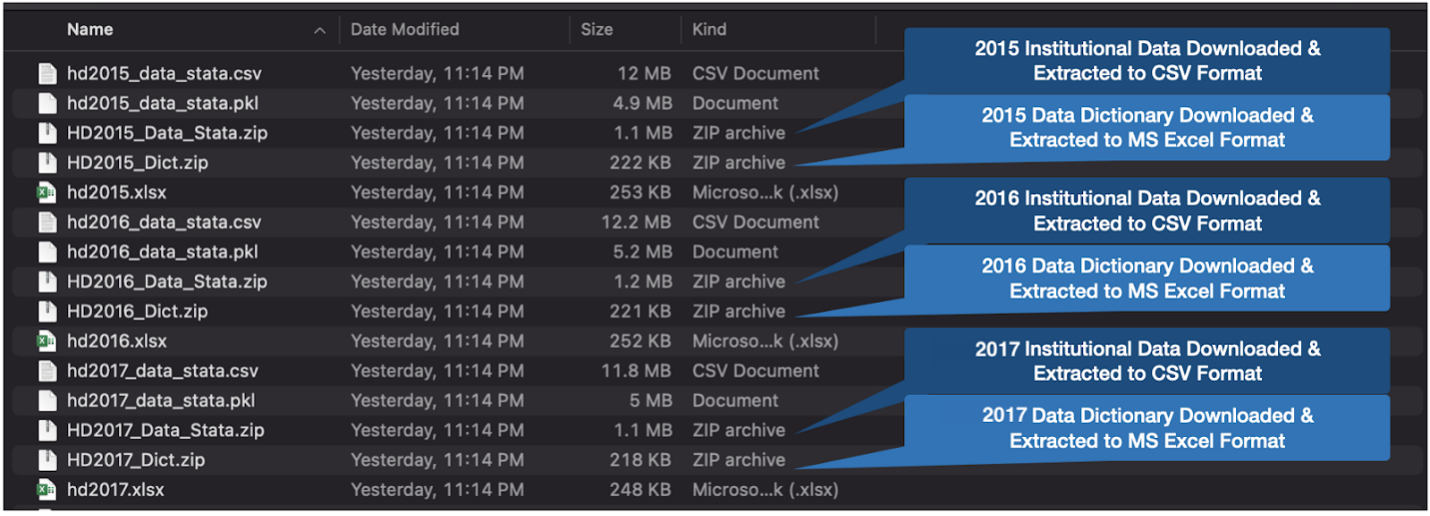
For the second step, a loop downloads the files and then also extracts and decompresses the archived files. When the process is through, those files will appear in the file explorer, similar to Figure 1.
Figure 1: Raw data files from the Integrated Postsecondary Education Data System (IPEDS).

For the third step, Python can read the data files and replace the “code values” with “code labels.” Code values are numerical codes that typically represent multiple choice pick list categorical data. Code values are difficult to read because the number codes do not correspond in a human-readable way, with their code labels. Utilizing data dictionaries provided by the National Center for Education Statistics (NCES), Python can replace those code values with code labels in 10 lines of code. These data dictionaries appear in Figure 1 as hdYYYY_Dict.zip.
For the fourth and fifth step, the Python code saves the data to disk and assembles a panel data set. In the process of saving to disk and assembling the panel data set, the code also establishes a new year variable, indicating from which year each record originated.
Conclusion
Save time and ensure reproducibility using these five steps, regardless which code you use.
If you build on this code for a project of yours, let me know. Also, if you need help troubleshooting, feel free to reach out.
 Adam Ross Nelson
Since 2020, Adam is a consultant who provides research, data science, machine learning, and data governance services. Previously, he was the inaugural data scientist at The Common Application which provides undergraduate college application platforms for institutions around the world. He holds a PhD from The University of Wisconsin - Madison in Educational Leadership & Policy Analysis. Adam is also formerly an attorney with a history of working in higher education, teaching all ages, and working as an educational administrator. Adam sees it as important for him to focus time, energy, and attention on projects that may promote access, equity, and integrity in education. This means he strives to find ways for his work to challenge system oppression, injustice, and inequity. He is passionate about connecting with other data professionals in person and online. For more information and background look for his insights by connecting with Adam on LinkedIn, Medium, and his website at coaching.adamrossnelson.com.


