Course Enrollment Trends Dashboard
University of Cincinnati students often take classes offered at other UC campuses and vice versa. UC Blue Ash regional campus administrators and academic chairs wanted to better understand how many UCBA students were taking classes at other UC colleges and what classes they were taking.
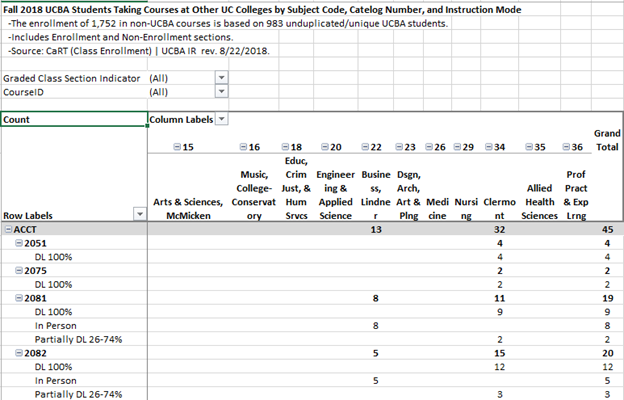
Typically, an Excel pivot table or PDF file would be utilized to provide this information (see Figure 1). Filters enable users to select certain courses, and more advanced Excel users could add additional filters if needed. However, some users were less familiar with Excel, and we wanted to provide additional interactive features that users would find valuable.
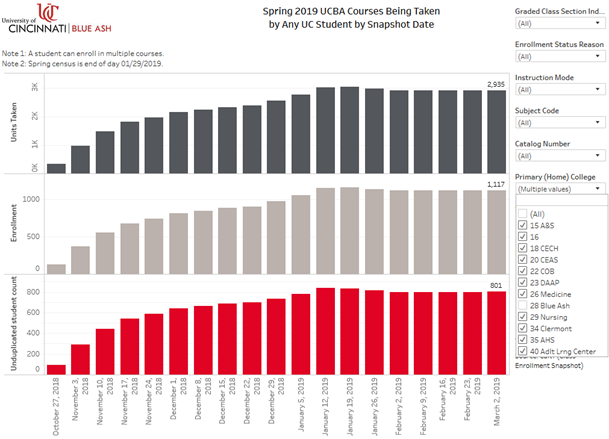
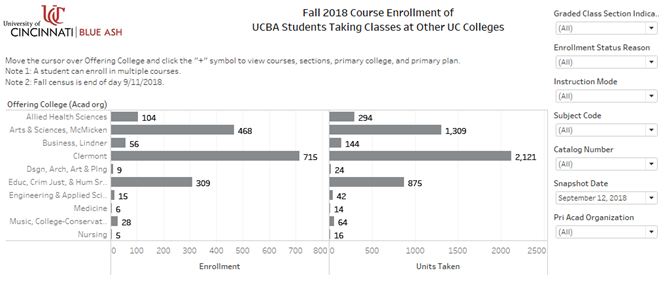
With Tableau, users can interact with weekly snapshot data to understand enrollment patterns and from which UC college students are taking UCBA courses (see Figure 2) or at what UC college UCBA students are taking courses (see Figure 3). Users can drill down and see other UC college courses being taken by UCBA majors. For example, what courses are Pre-Business Administration majors taking at other UC colleges and by which instructional mode?
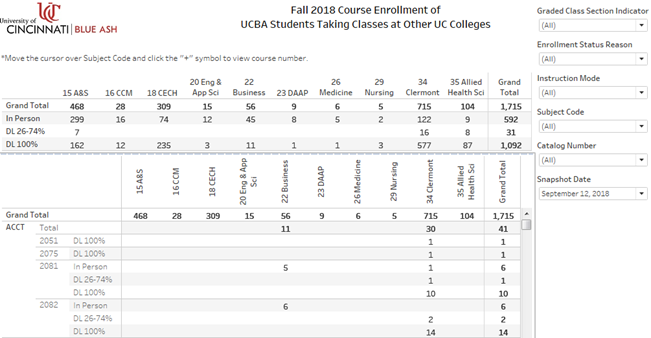
While valuable, feedback revealed that users were most interested in seeing a more concise picture of enrollment by college, instructional mode, and course (see Figure 4). A similar dashboard shows enrollment in UCBA courses from other UC colleges.
Tableau is a powerful tool that makes it easier to interact with and display data in a variety of ways. Enabling campus users to utilize course enrollment data has helped them better understand the course taking patterns of our students. Feedback from end users helped to enhance the usability of the data and continues to do so. For example, a student major filter would enable chairs to see what courses students are taking by major. These dashboards are only available from an internal UC site.
View a larger PDF version.
Figure 1.

Figure 2.

Figure 3.

Figure 4.


