Creating Quick, Easy, and Cheap Video Tutorials for Data Consumers
Eight years ago, the Association of Schools and Programs of Public Health (ASPPH) launched on online system of annual reporting and analytics for our member graduate schools and programs. Members were eager to stop reporting data via Excel sheets and email and hoped that this new reporting system would mean a much faster turnaround on annual data reports and analytics. While it did greatly improve efficiency, we continue to make changes to reporting each year that require annual updates to training and support services. As such, we have several different resources for our members that are reporting data, including:
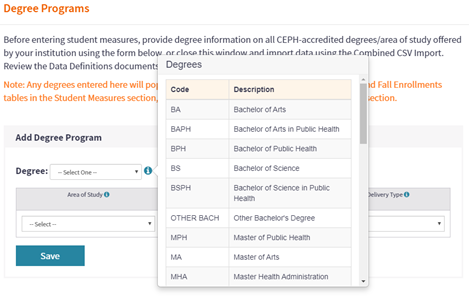
- Built-in information pop-ups

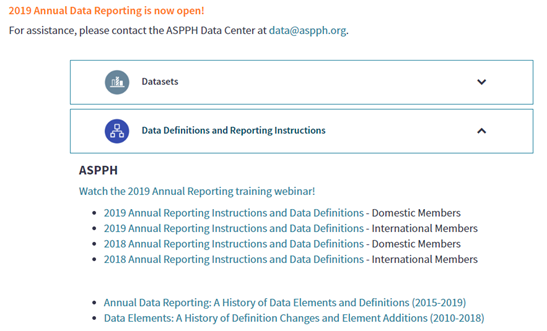
- Instructions and Data Definitions as well as a history of changes to data reporting

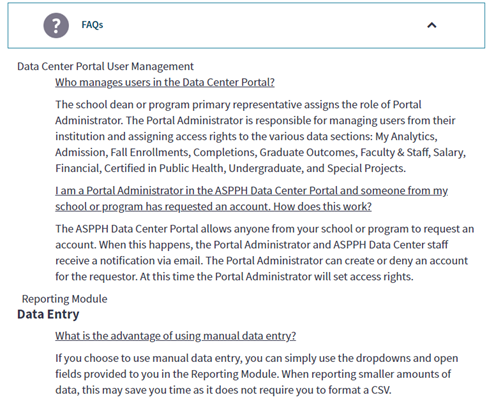
- Frequently Asked Questions

- An annual training webinar
- A series of brief video tutorials

The video tutorials are created using Microsoft PowerPoint and YouTube Audio Library. Each PowerPoint presentation consists of 10-20 slides and follows the same arch:
- Welcome
- What are we asking for?
- How can the user provide that information?
- Tips and Tricks
- Additional Support resources
- Close
We use images to further clarify website navigation, and we keep design and color basic so as not to distract the viewer from the information we want them to consume. We also use slide transitions and animations to keep the tutorial moving. Using free, opensource music from YouTube Audio Library gives the presentation a video feel, and we record the presentation with slide timing. Once we are happy with the recorded presentation, we click on export and convert to video. From there the video is embedded in our website.
In the future we may use voice over for further clarity, and we would like to create similar tutorials for our dashboards. You can see one of our tutorials here. Questions? Contact the ASPPH Data Center at data@aspph.org.
